One data model, many ways to see it. Twenty 2D charts and twelve 3D charts, captured from the chart demonstration Apps using synthetic data.
Select a chart to inspect its labels at full resolution. These examples show combinations of marks, layers, and layouts—not a limit on possible chart styles.
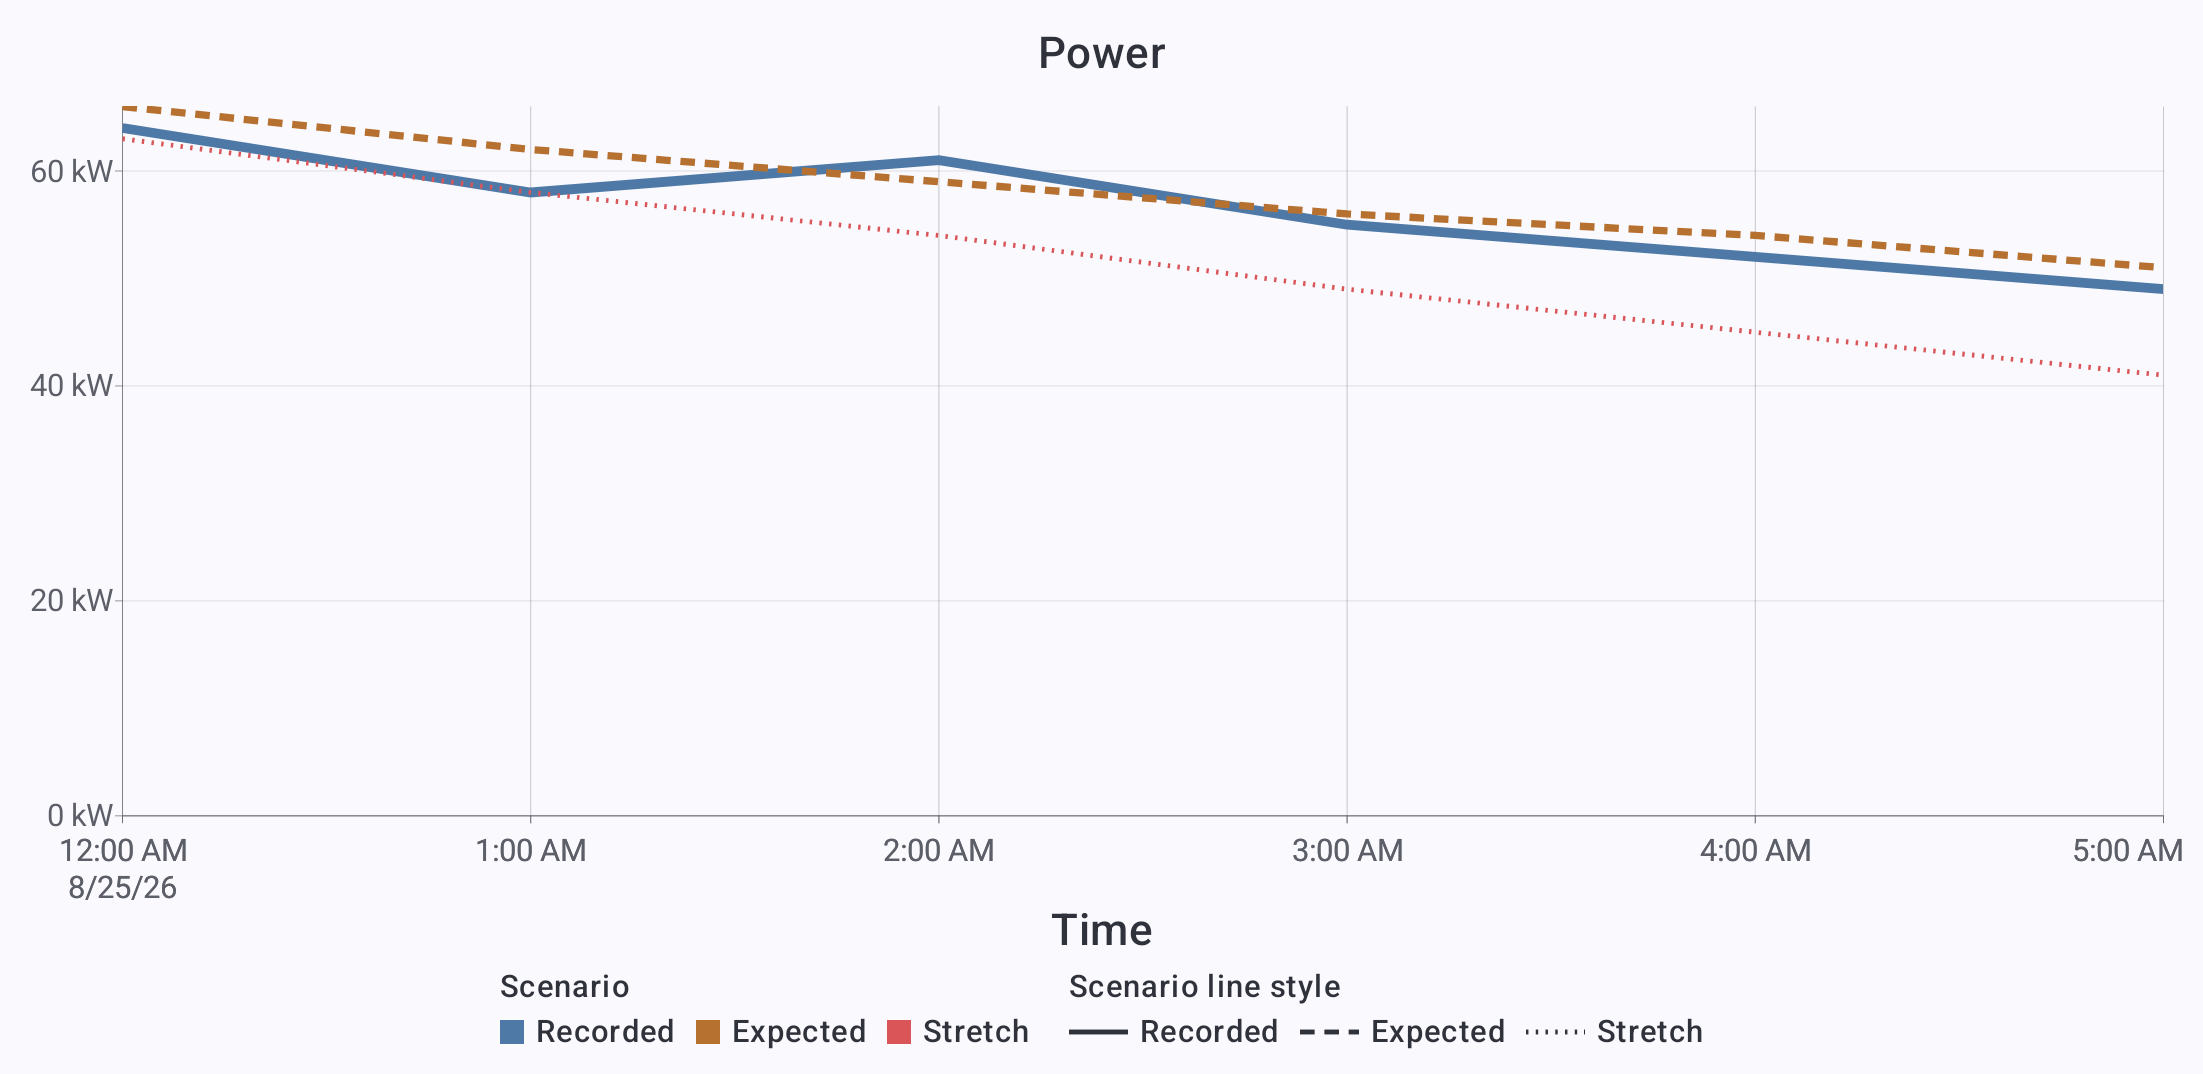
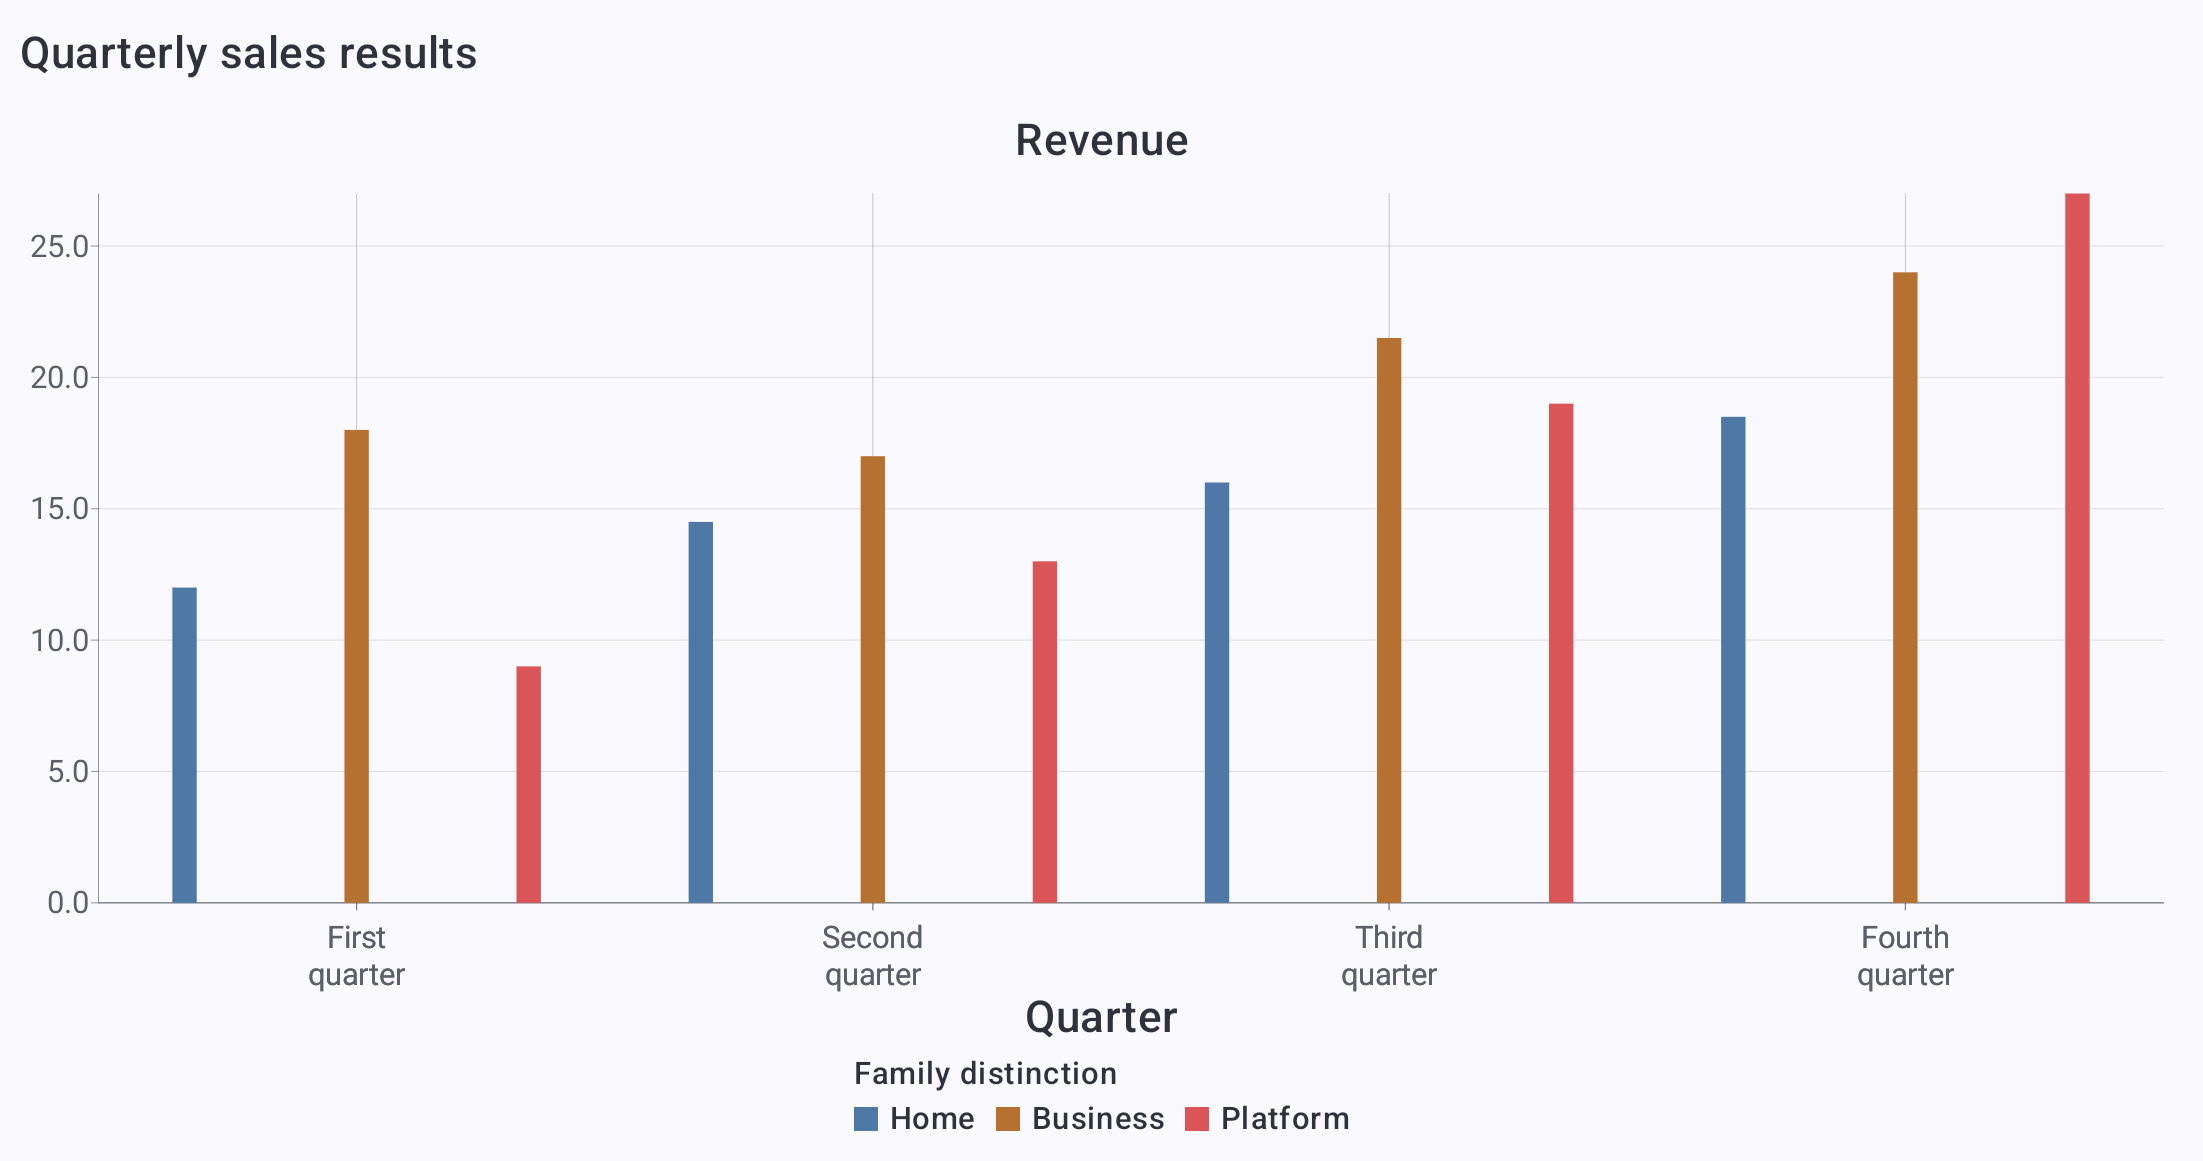
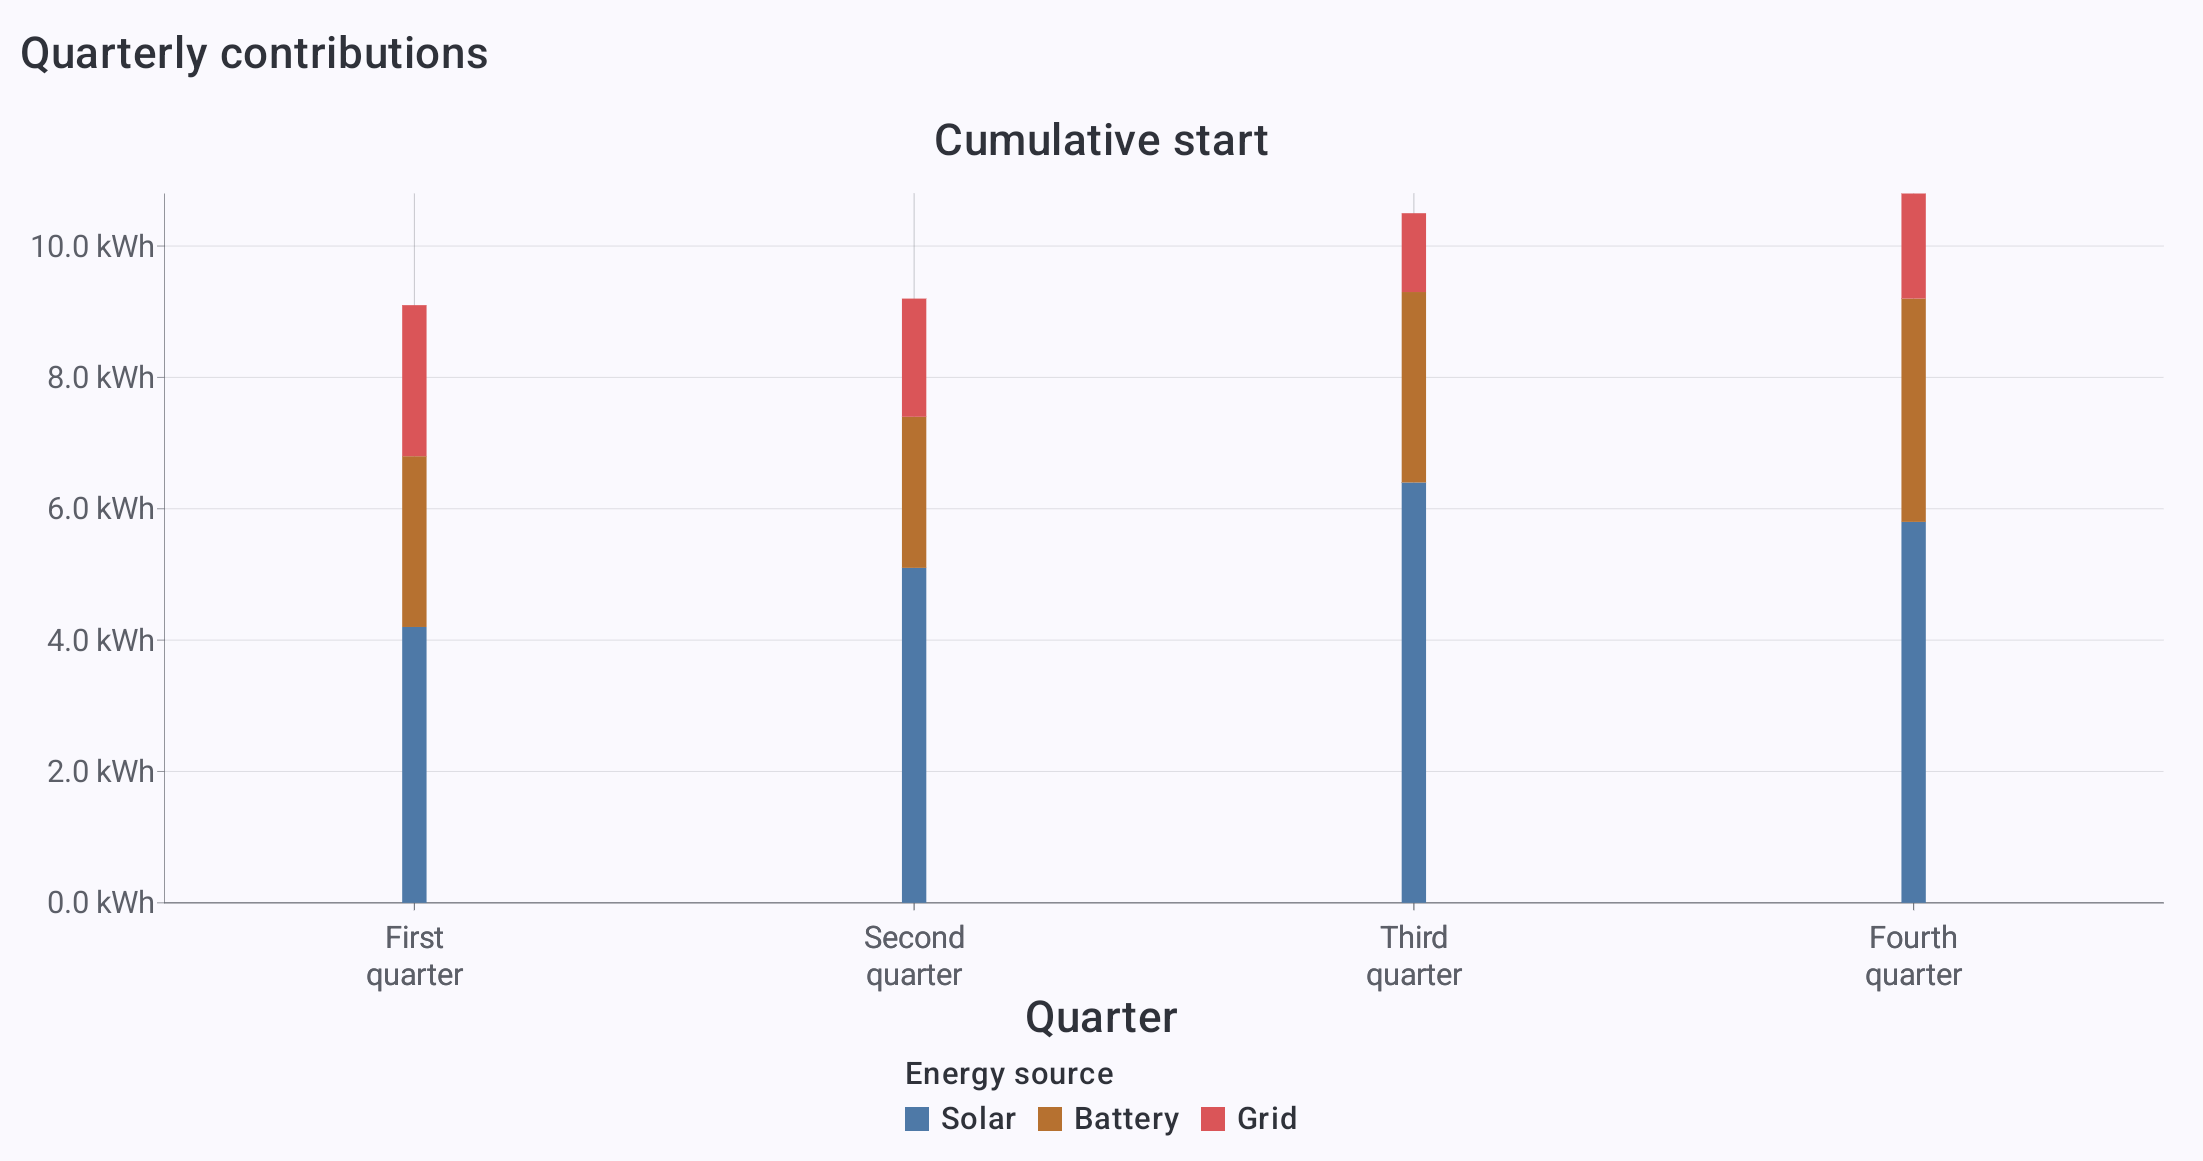
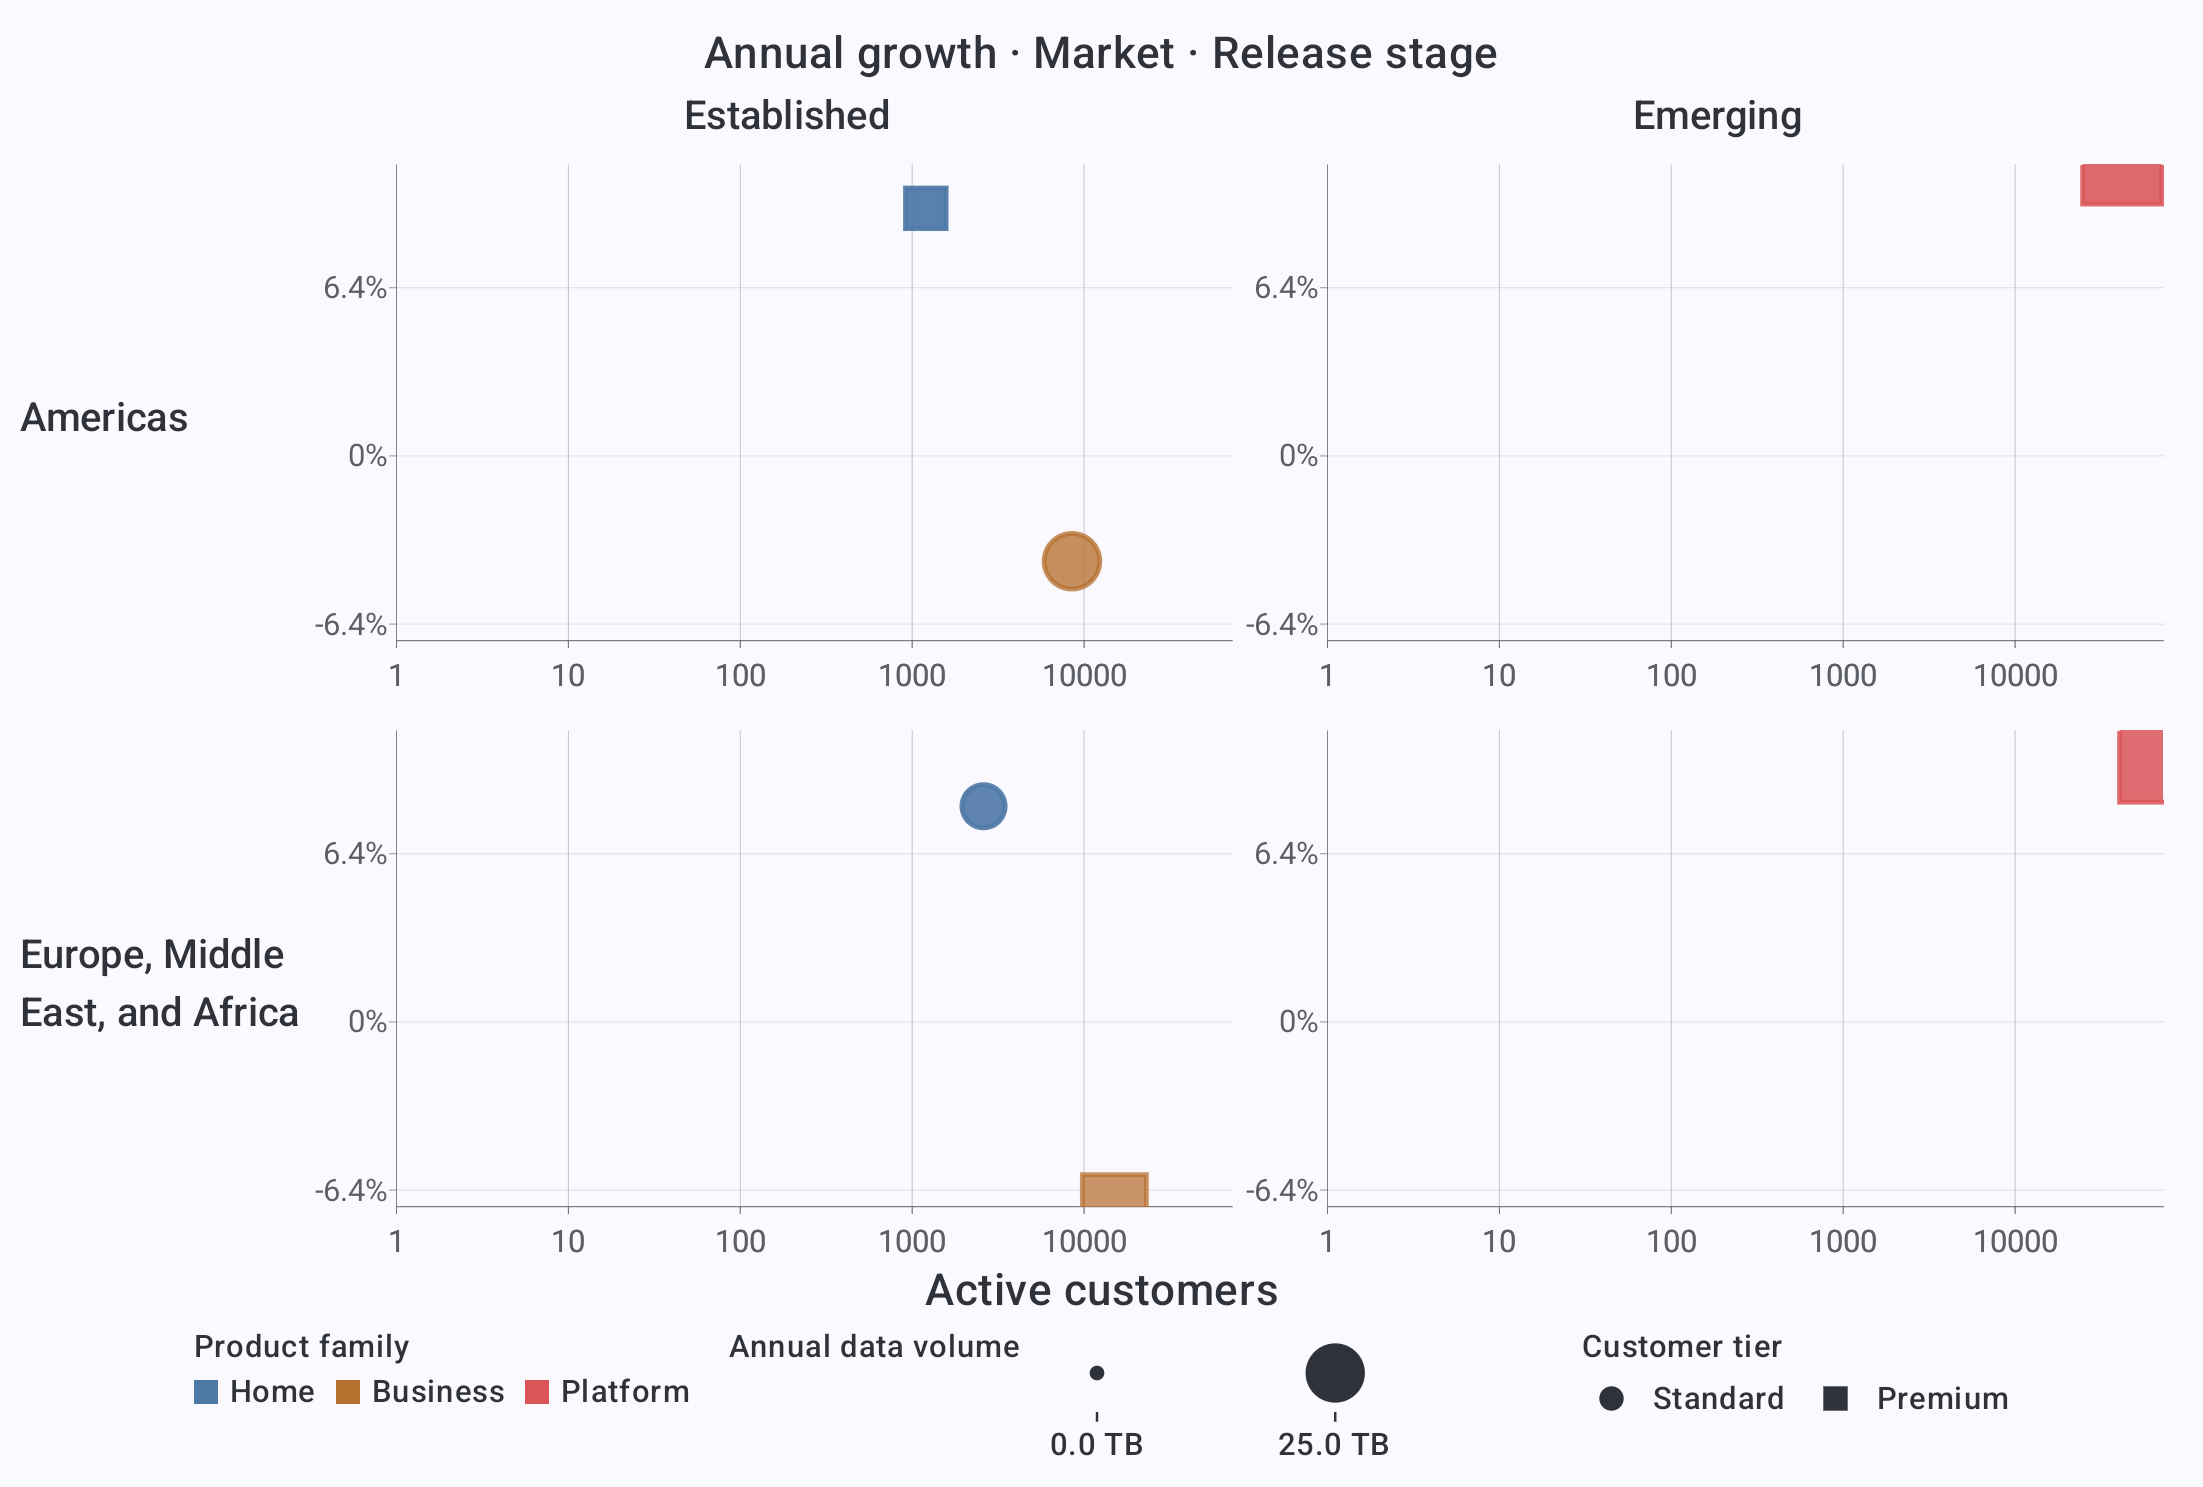
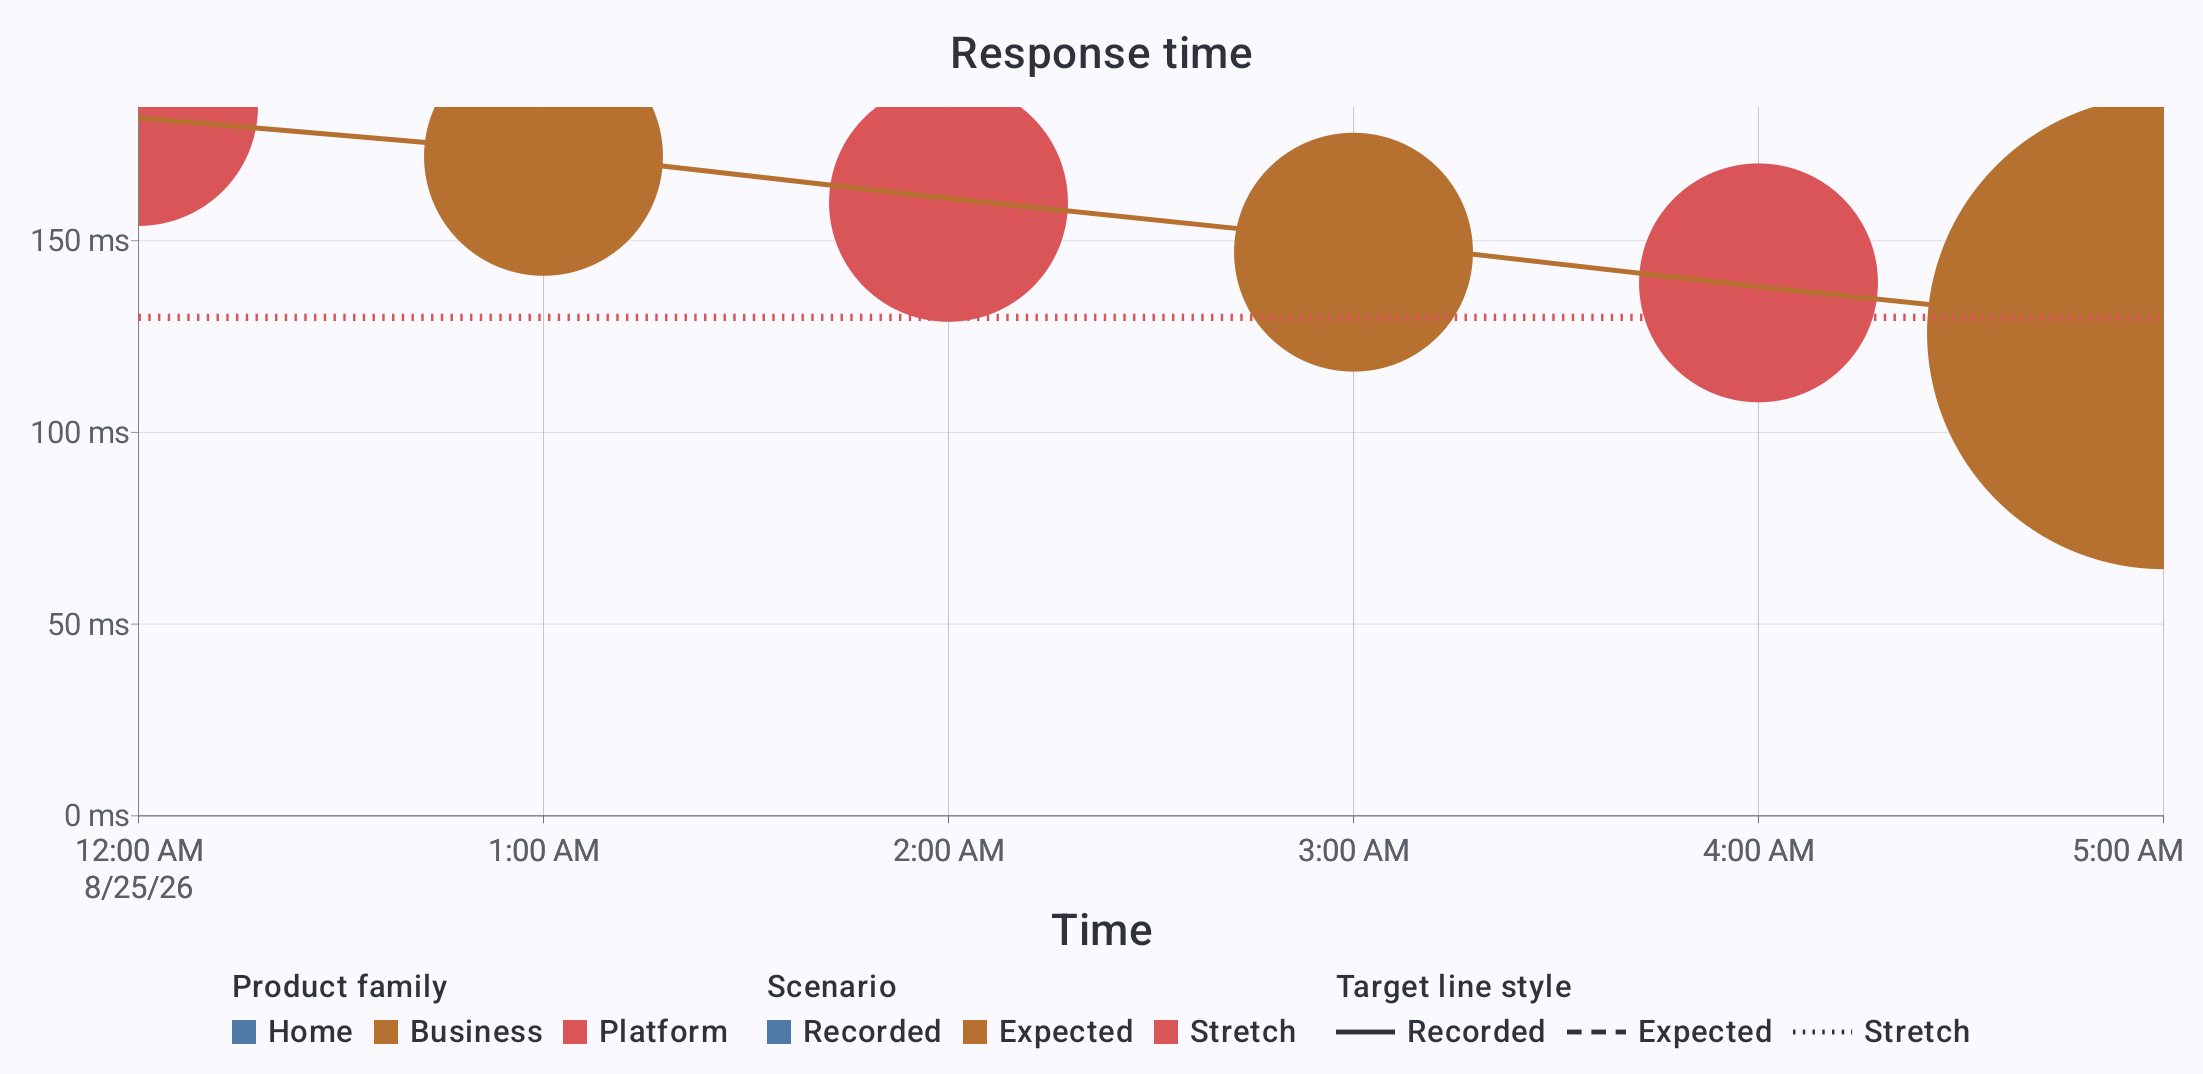
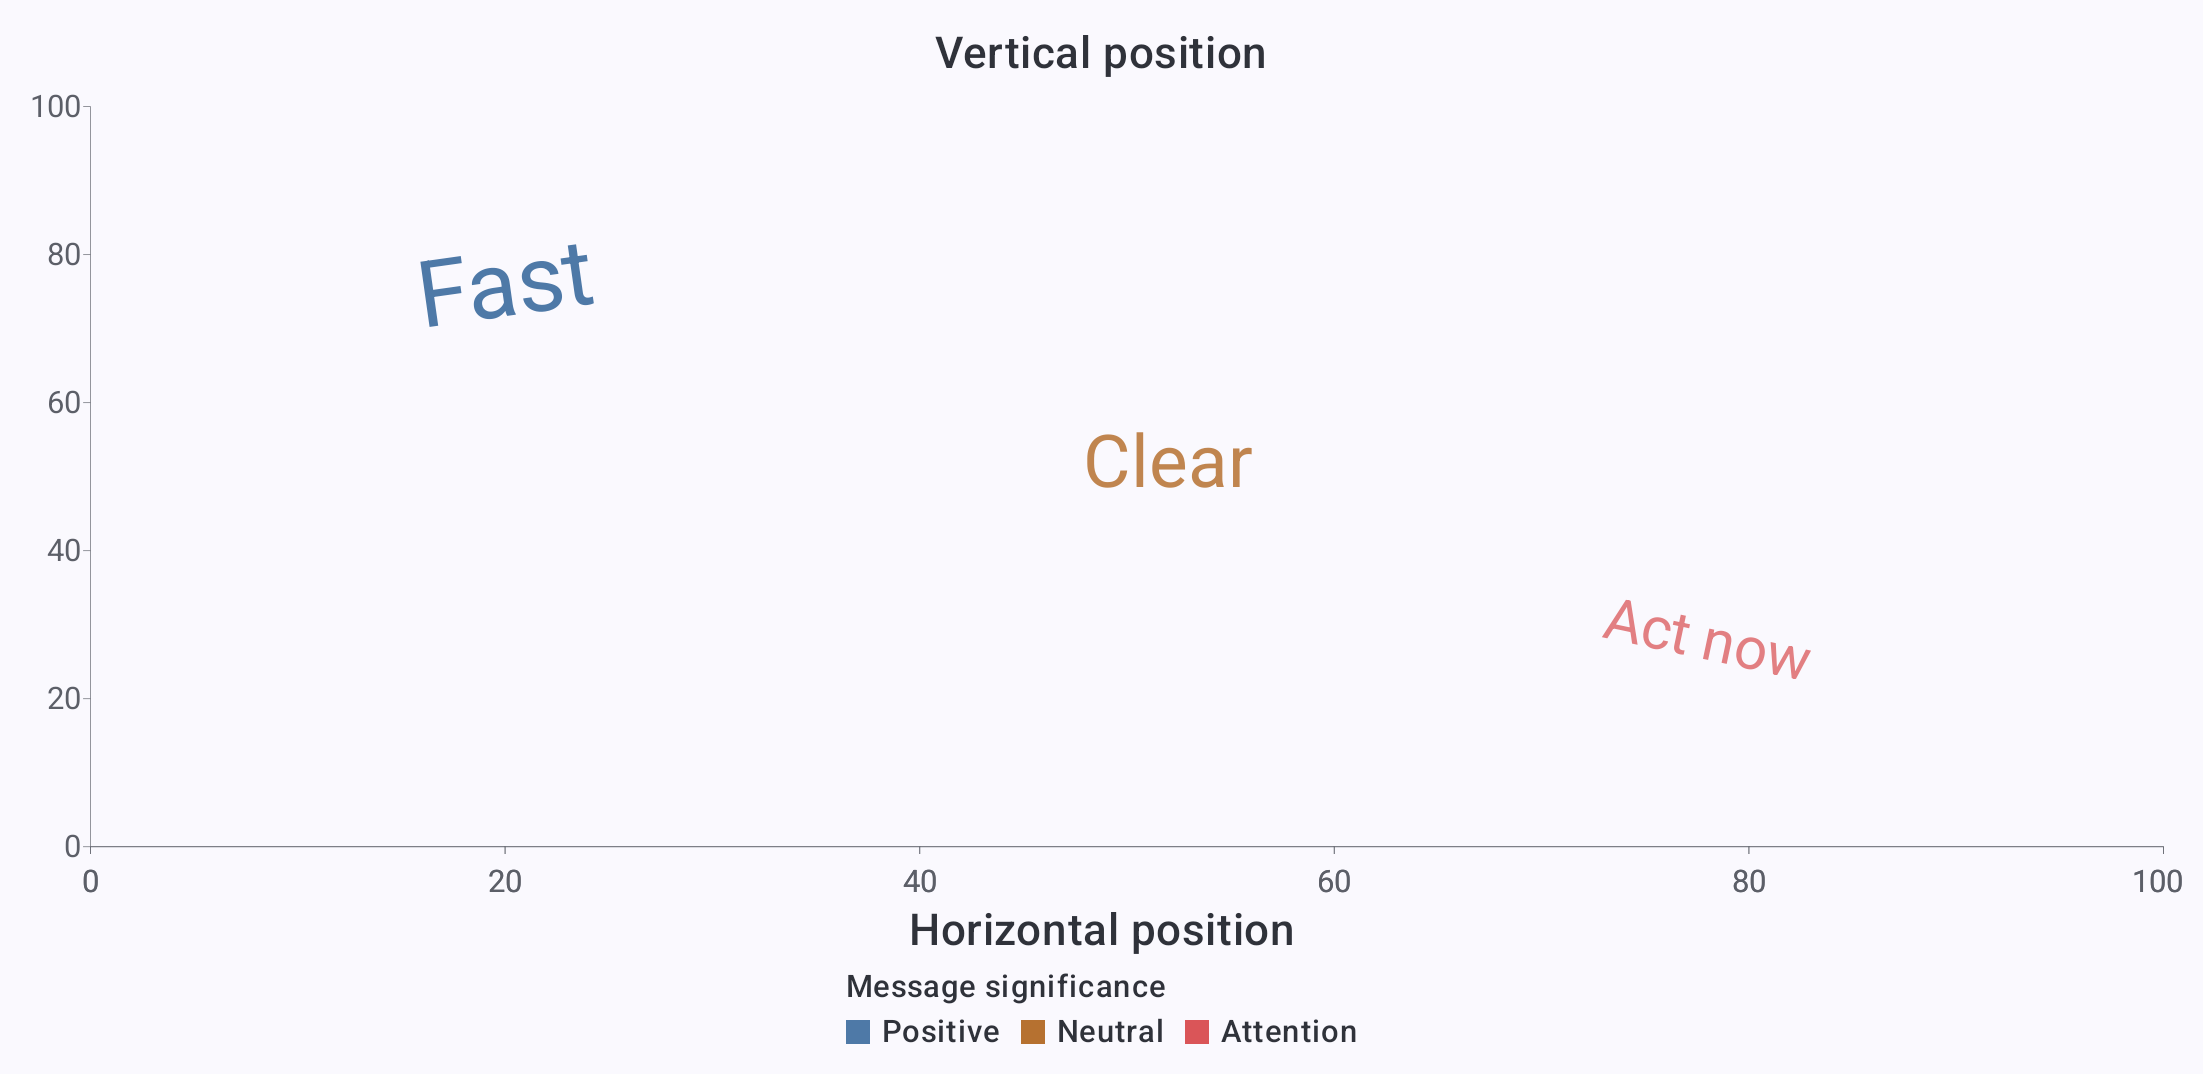
Line · Compare recorded, expected, and stretch power demand.Grouped bars · Compare product-family revenue across quarters.Stacked bars · Show how solar, battery, and grid contributions form a total.Faceted bubbles · Compare growth and reach across markets and release stages.Layered performance · Combine bubbles, a trend line, and a target in one plot.Text annotations · Place meaningful text with data-driven color, size, and angle.
Ranges and distributions
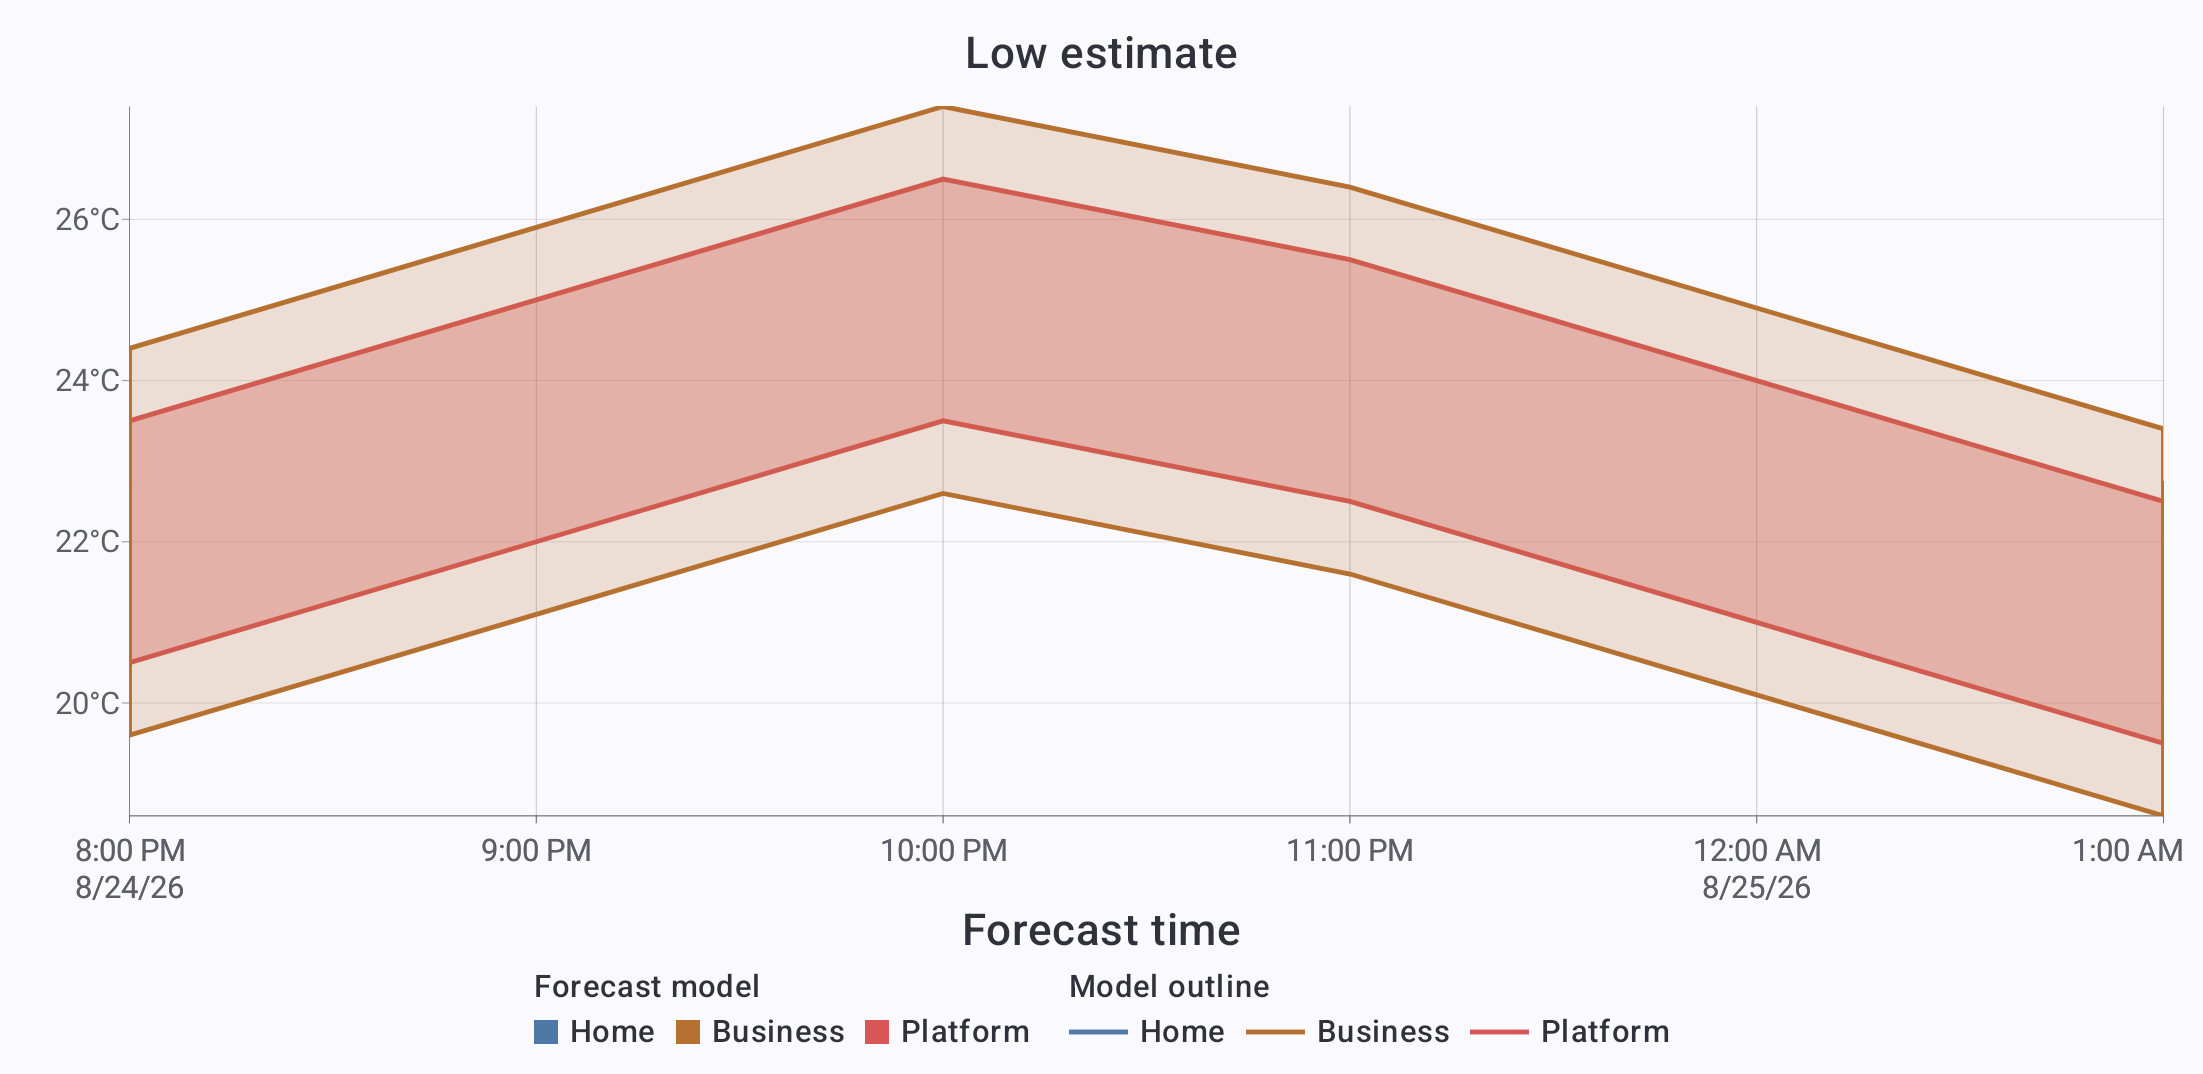
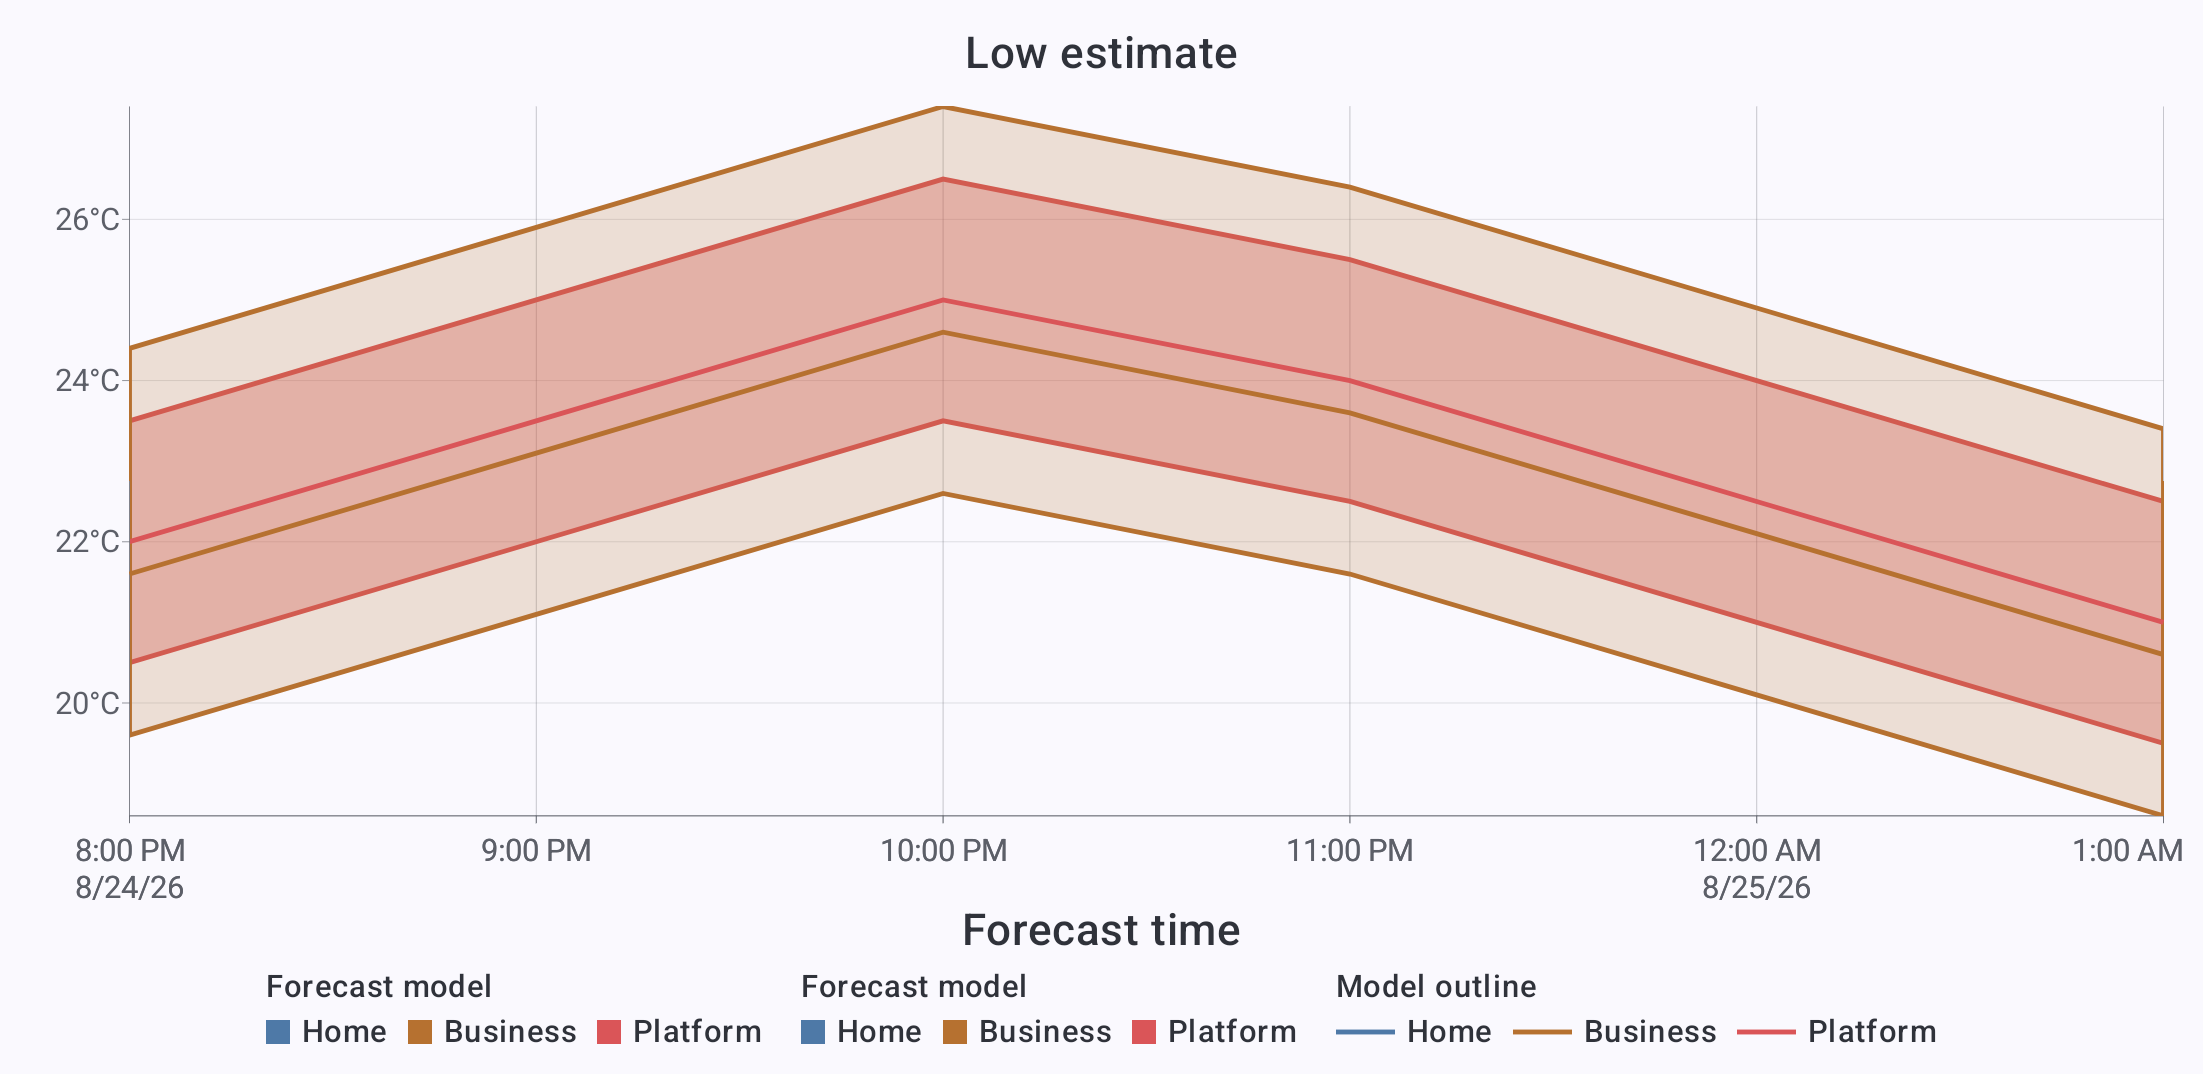
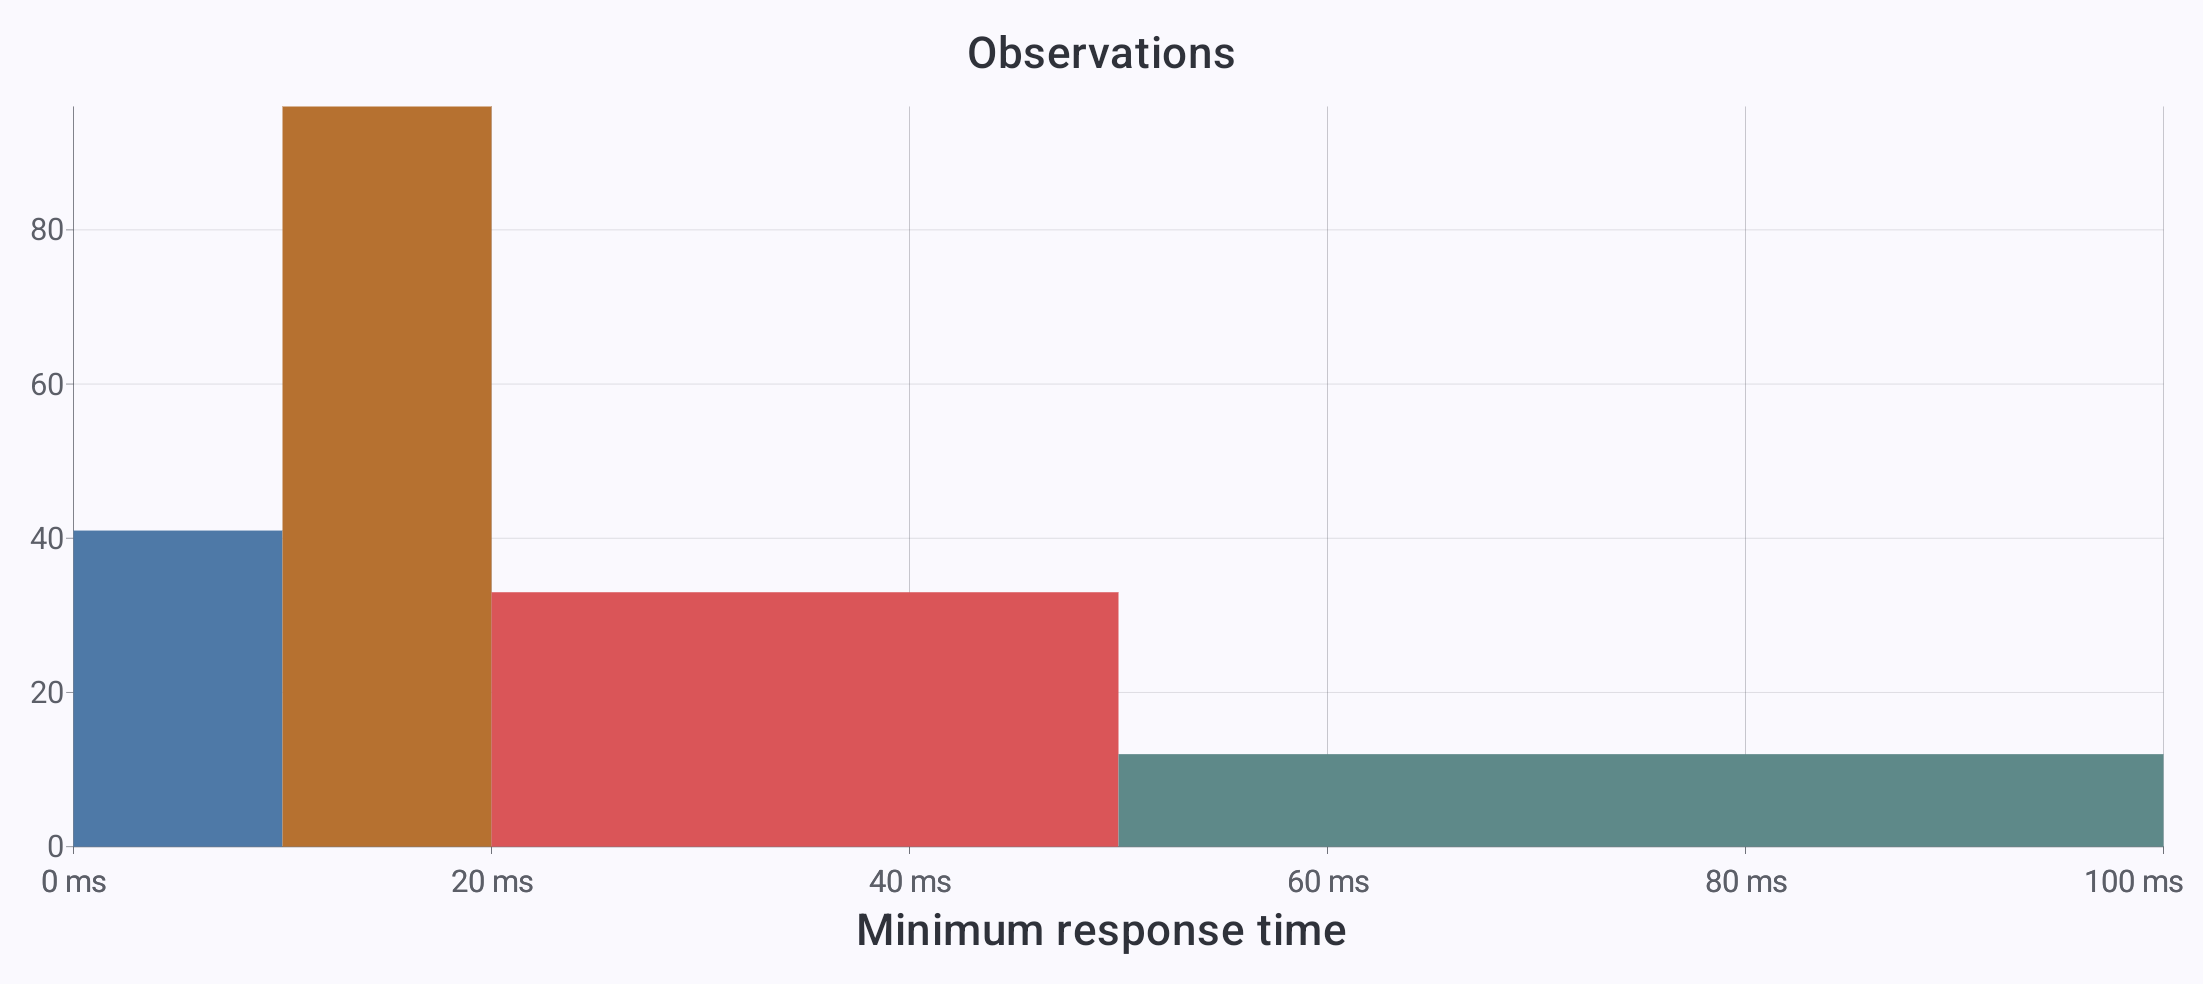
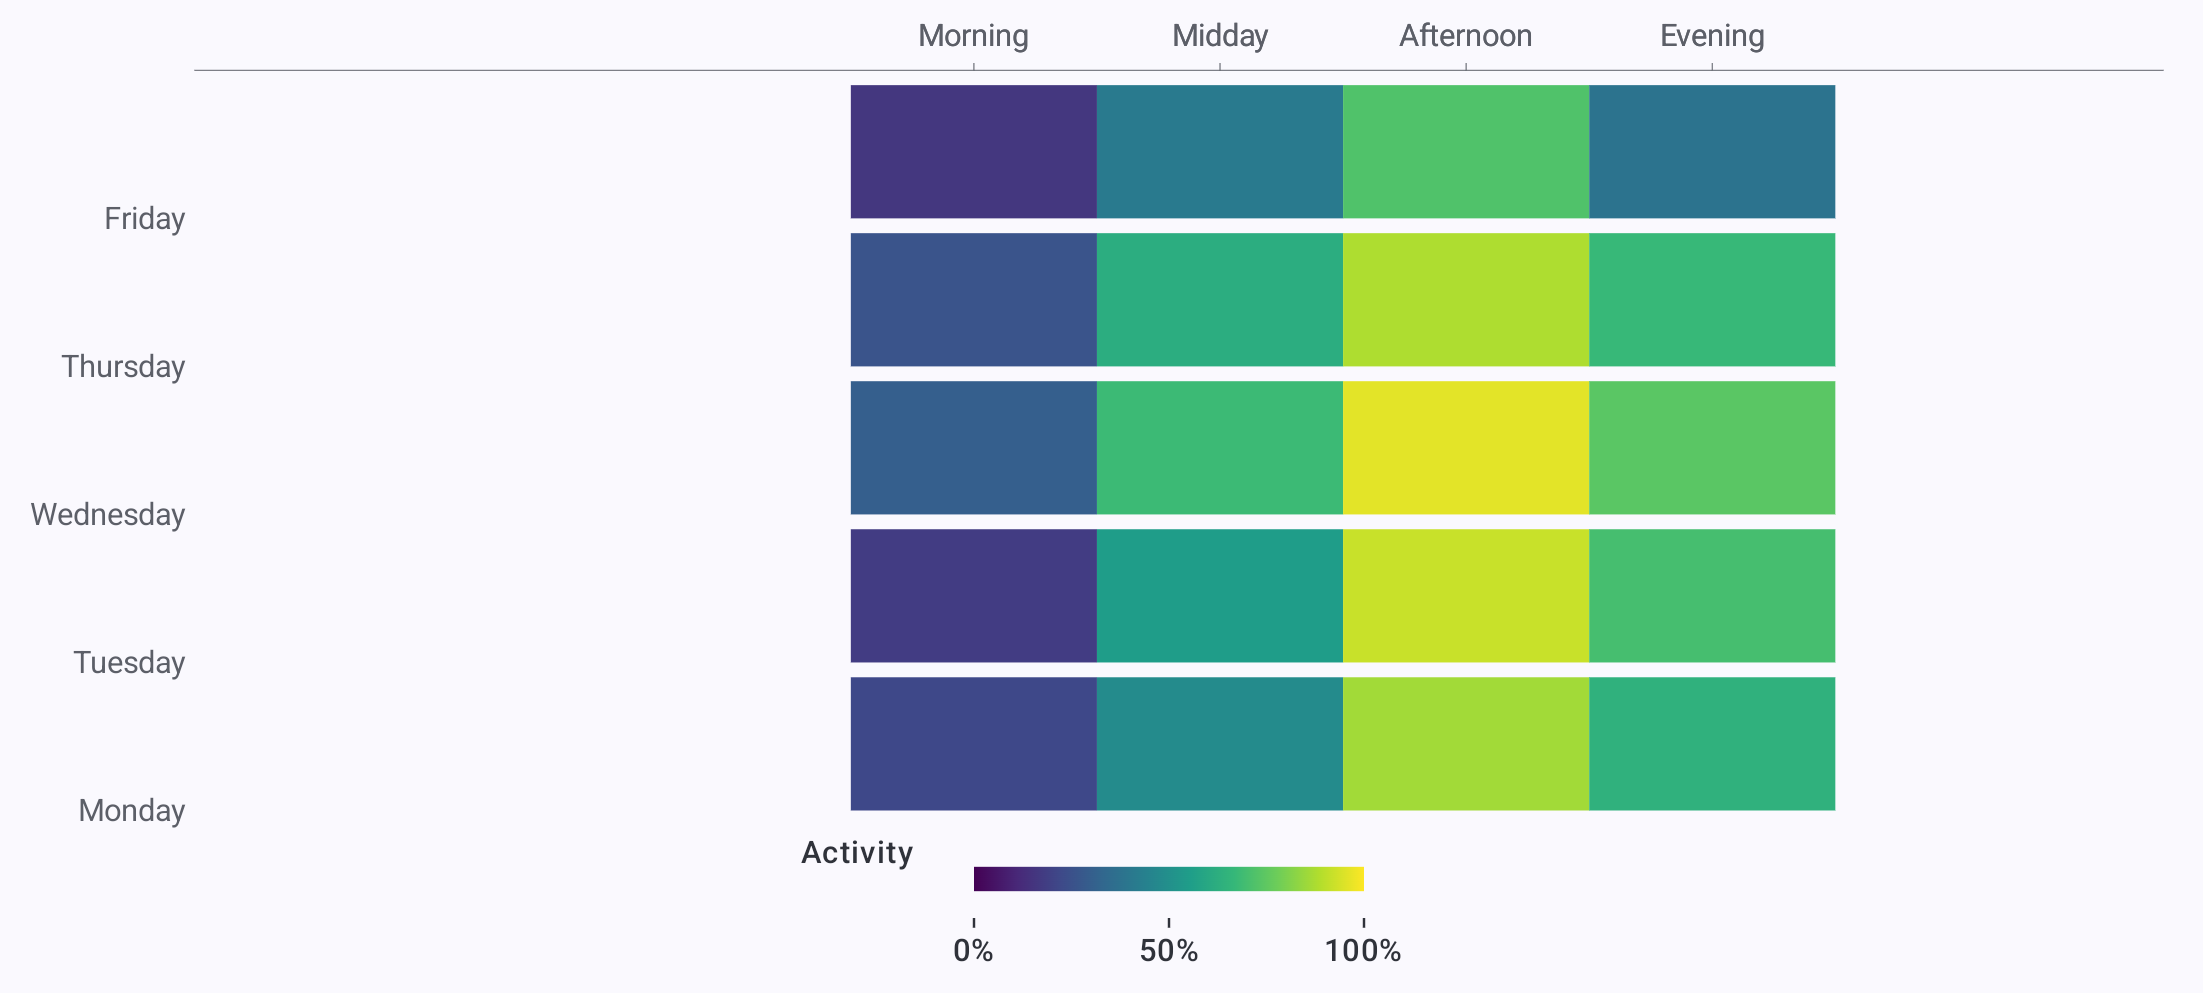
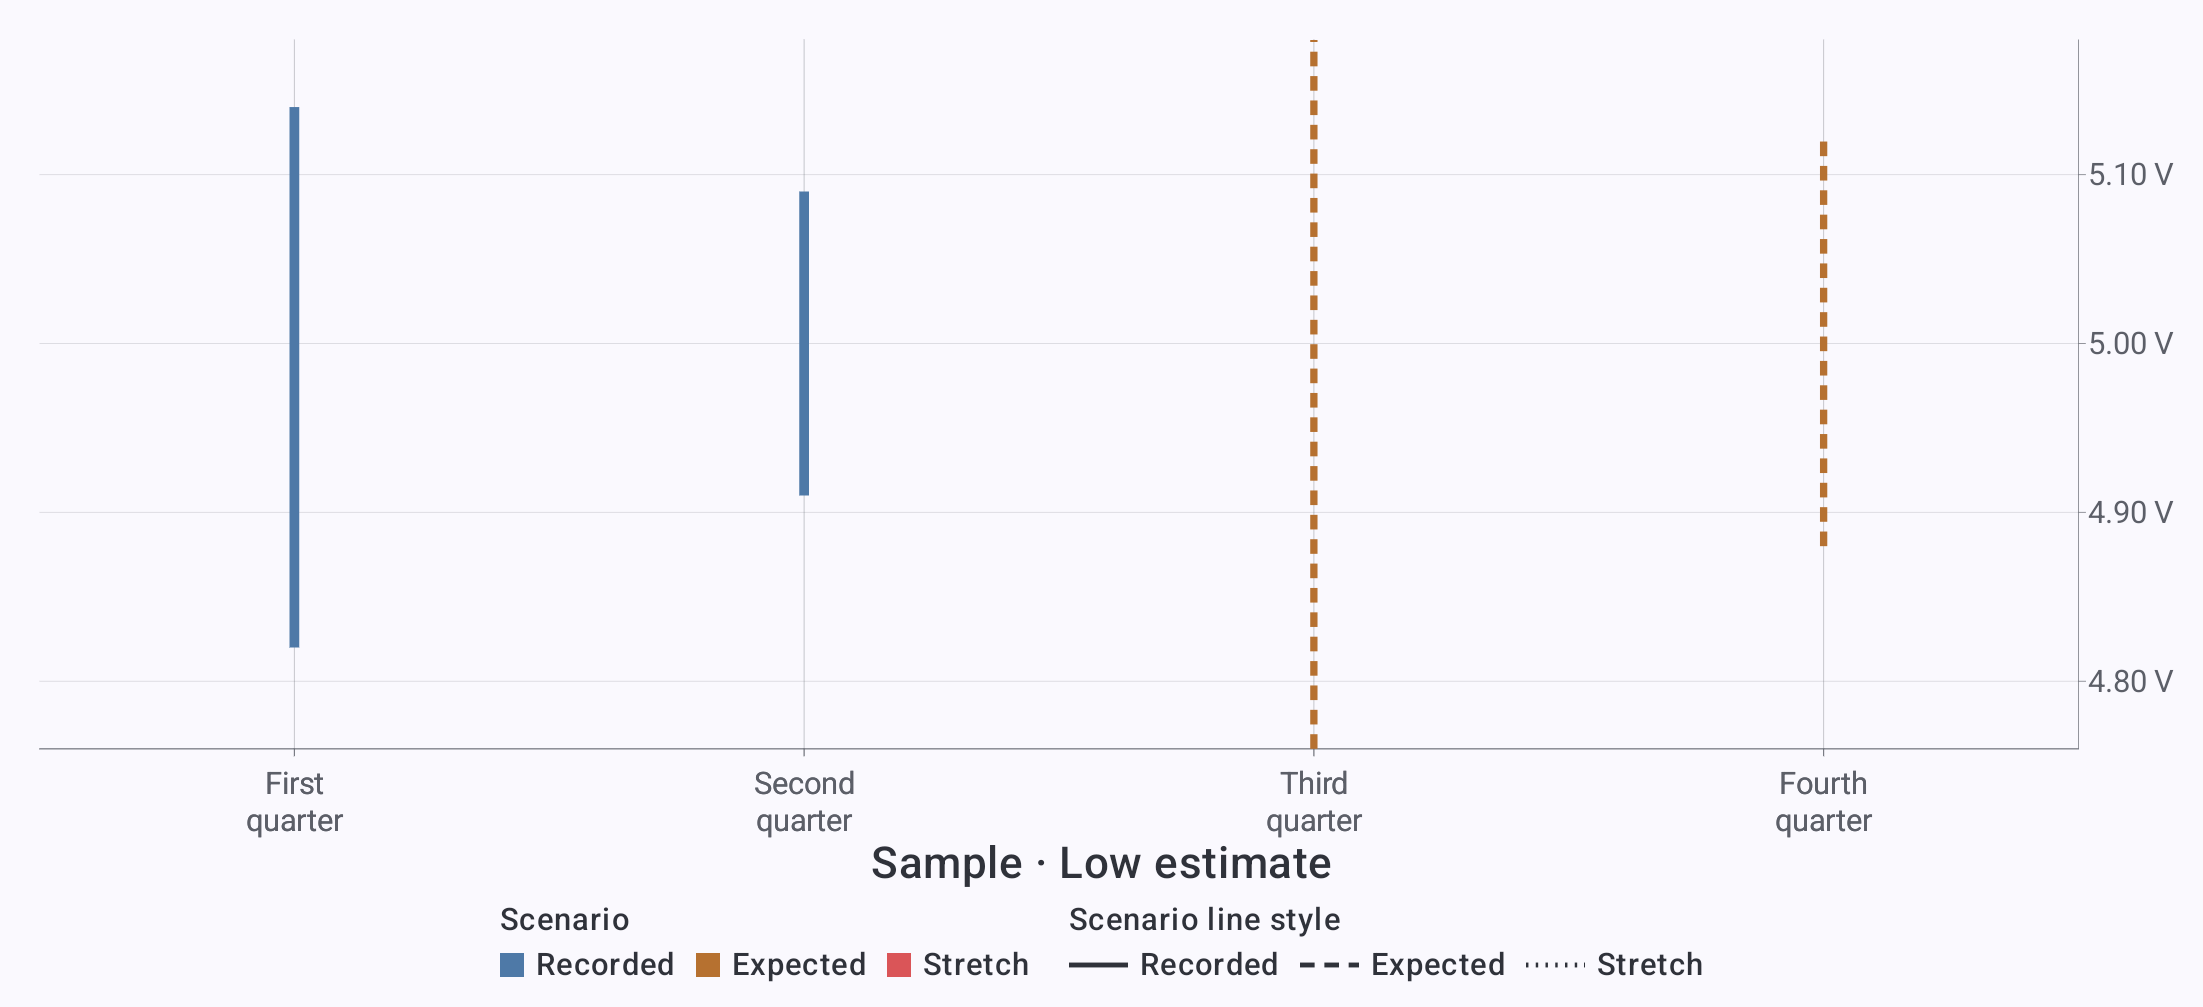
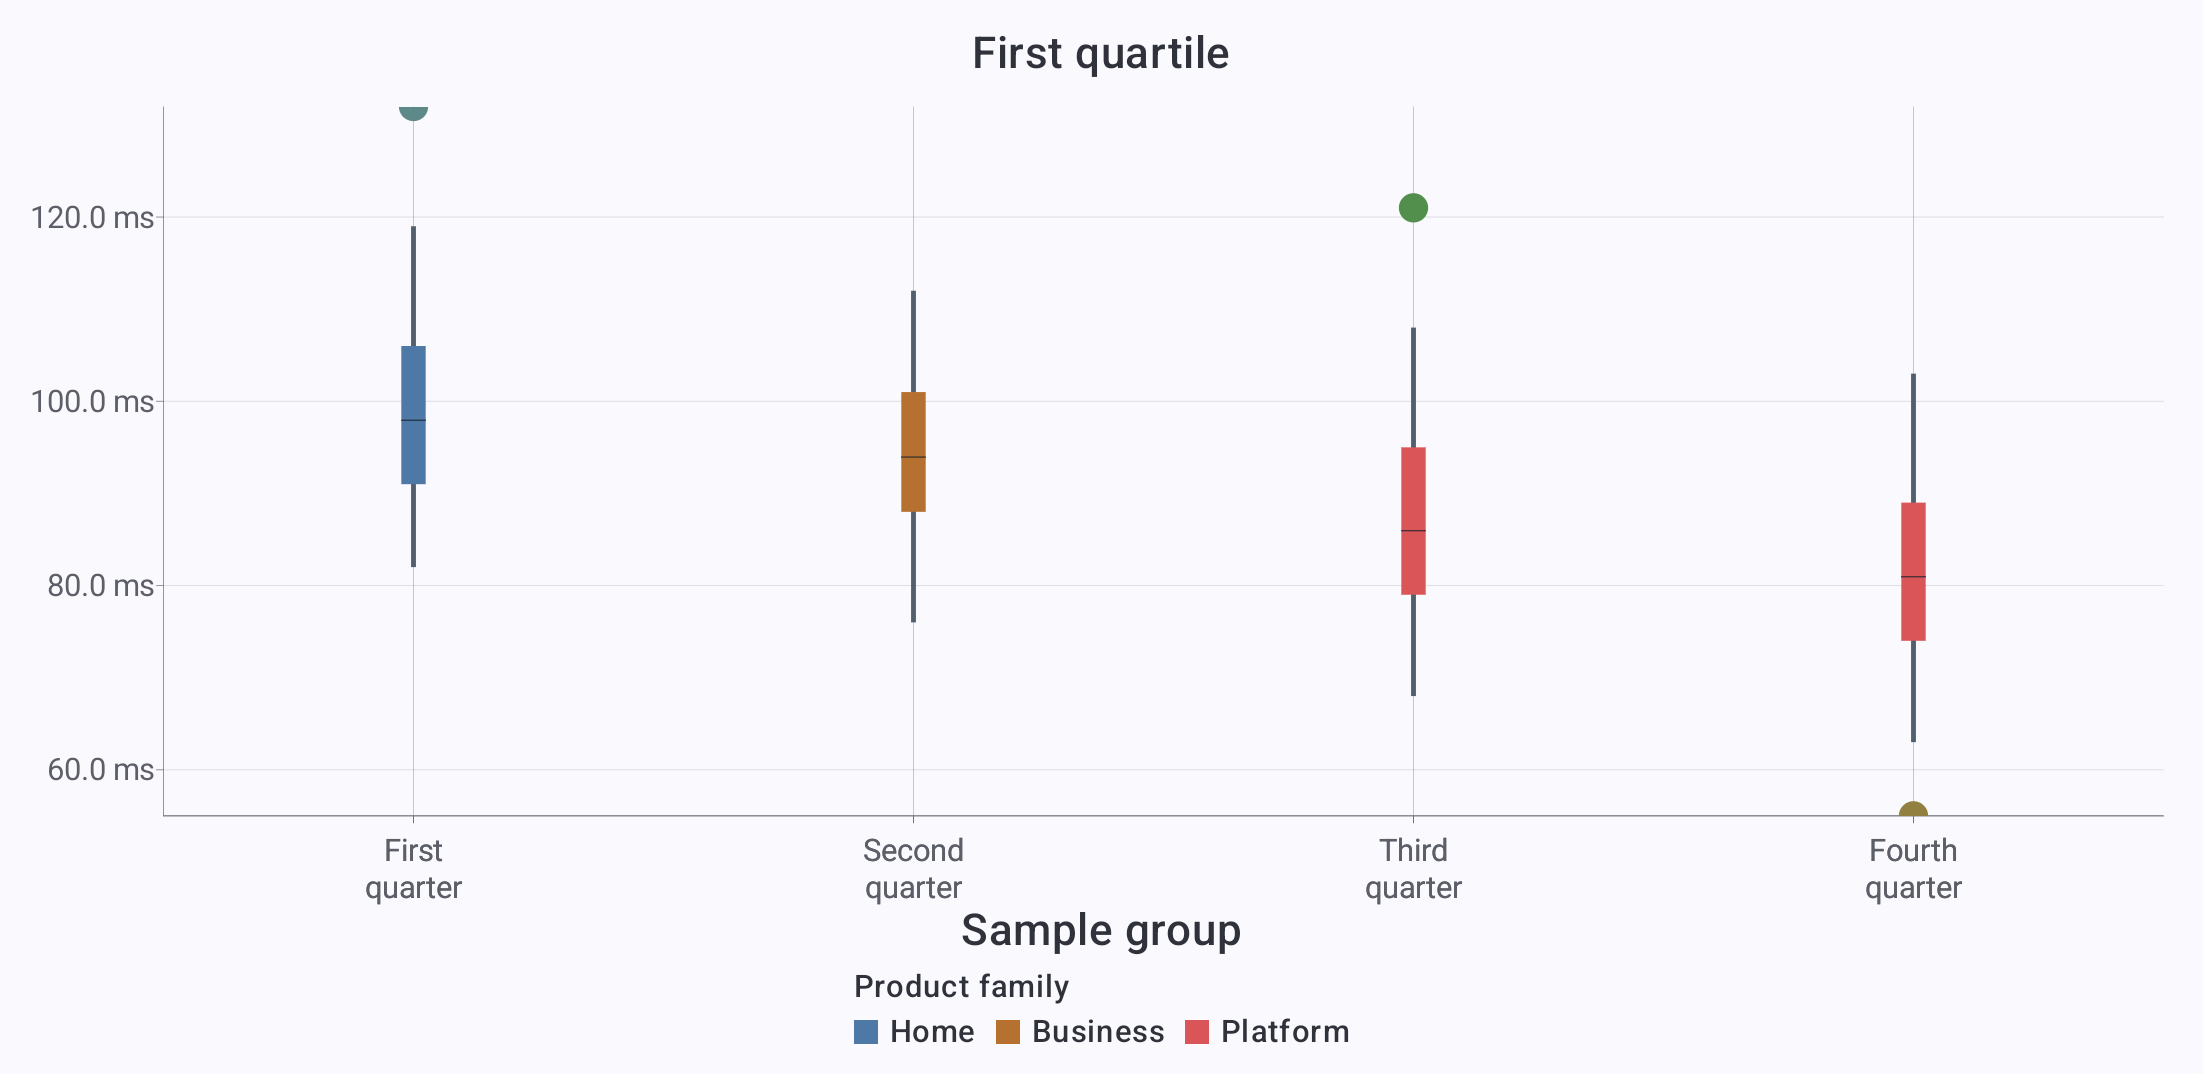
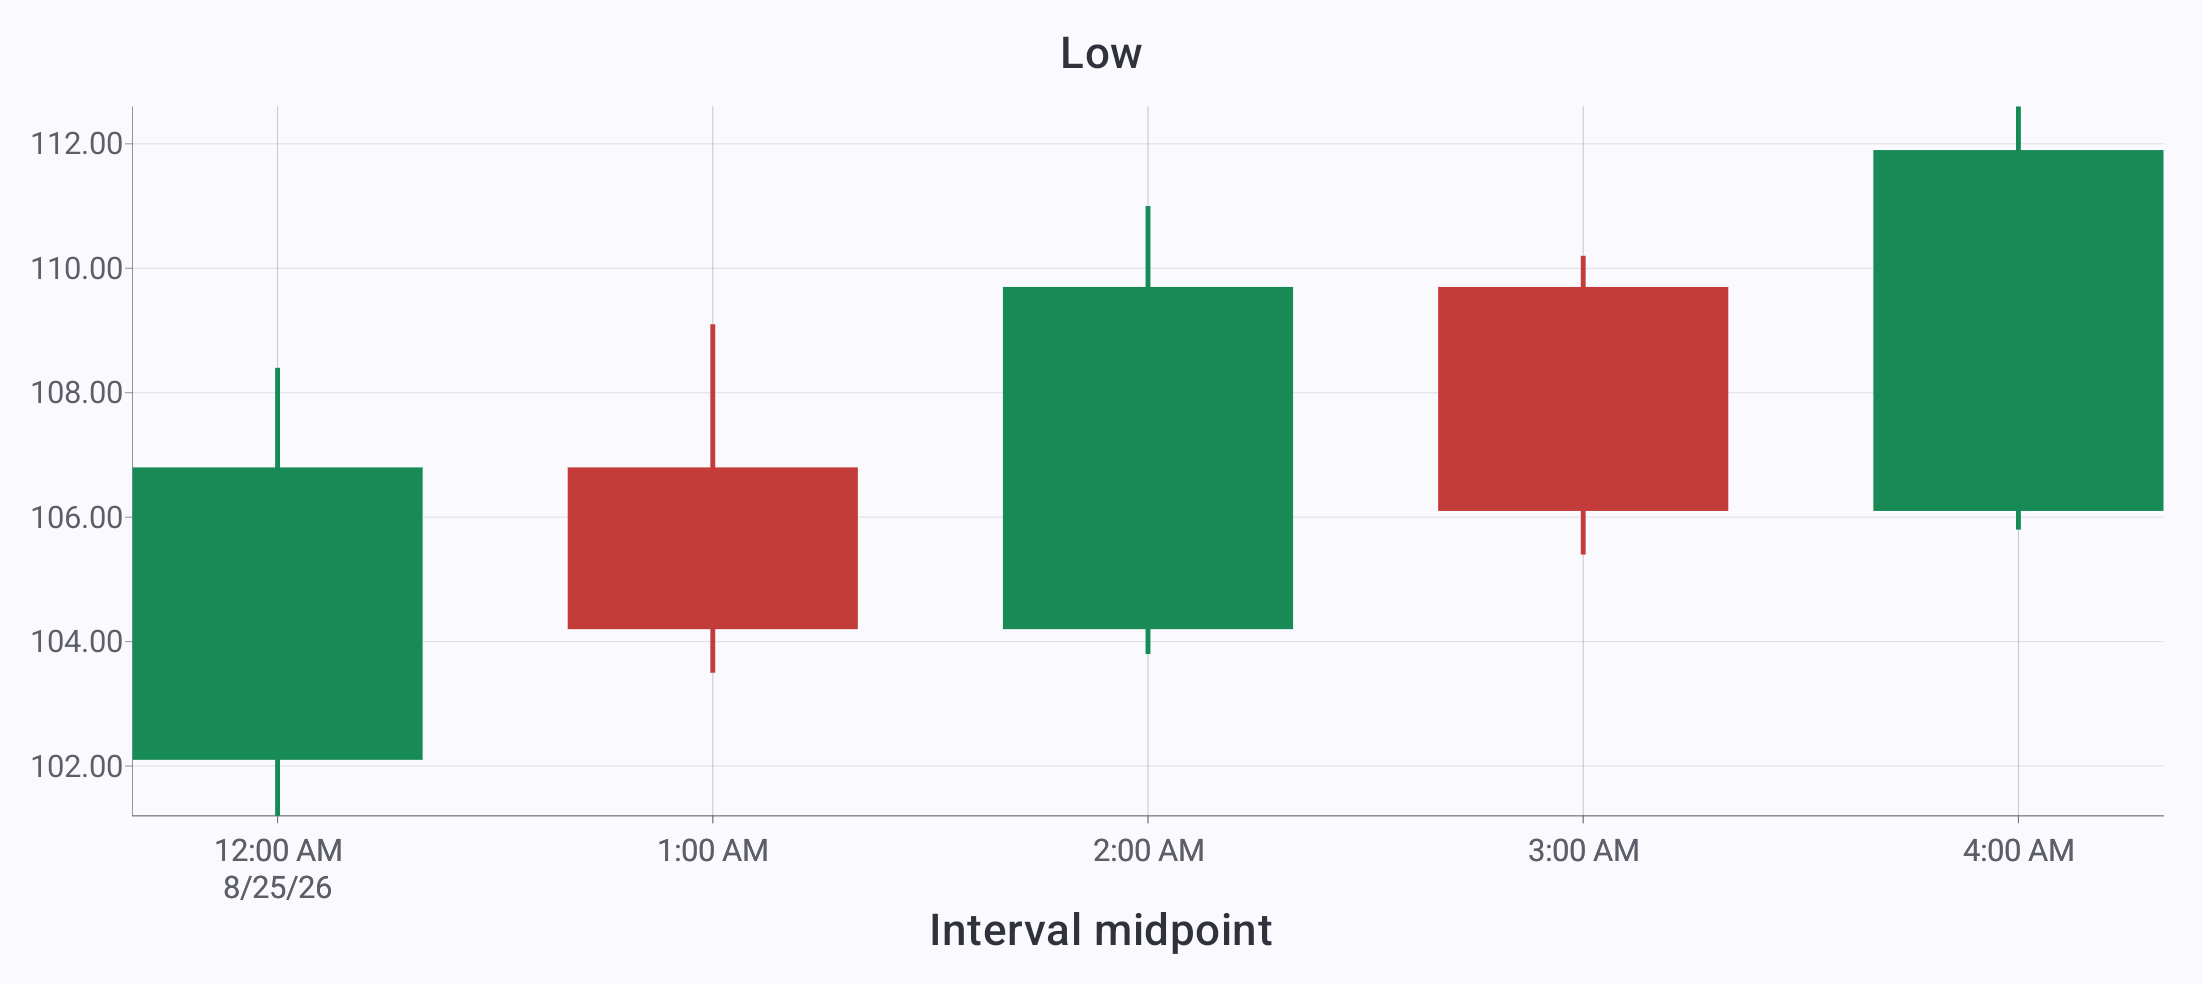
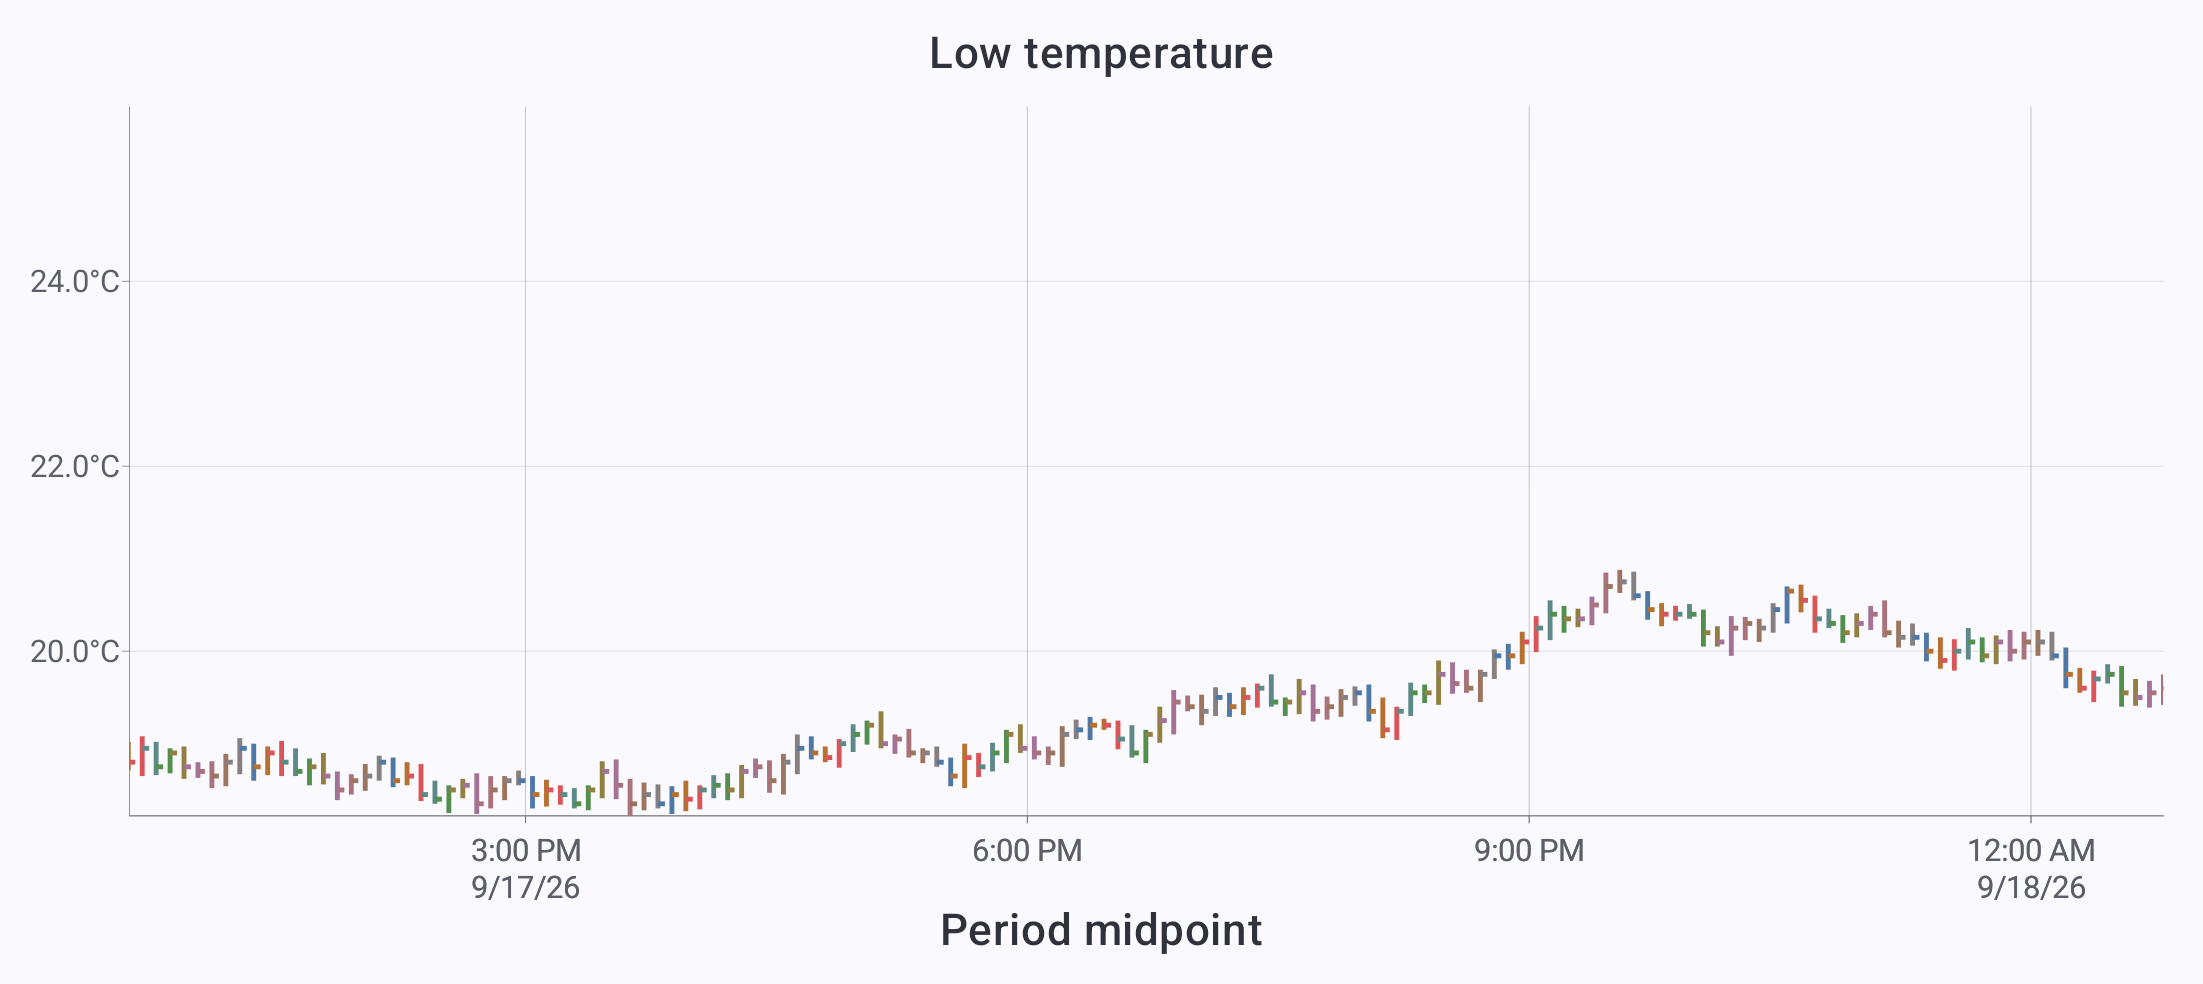
Forecast ranges · Compare low-to-high temperature bands over time.Confidence bands · Layer central estimates over forecast ranges.Histogram · Group response times into intervals of different widths.Heatmap · Compare activity by weekday and time of day.Error bars · Show the uncertainty interval for each electrical sample.Box plot · Compare medians, quartiles, whiskers, and outliers.Candlestick · Show opening, closing, high, and low prices.High–low–close · Show each temperature interval’s range and final value.
Polar charts
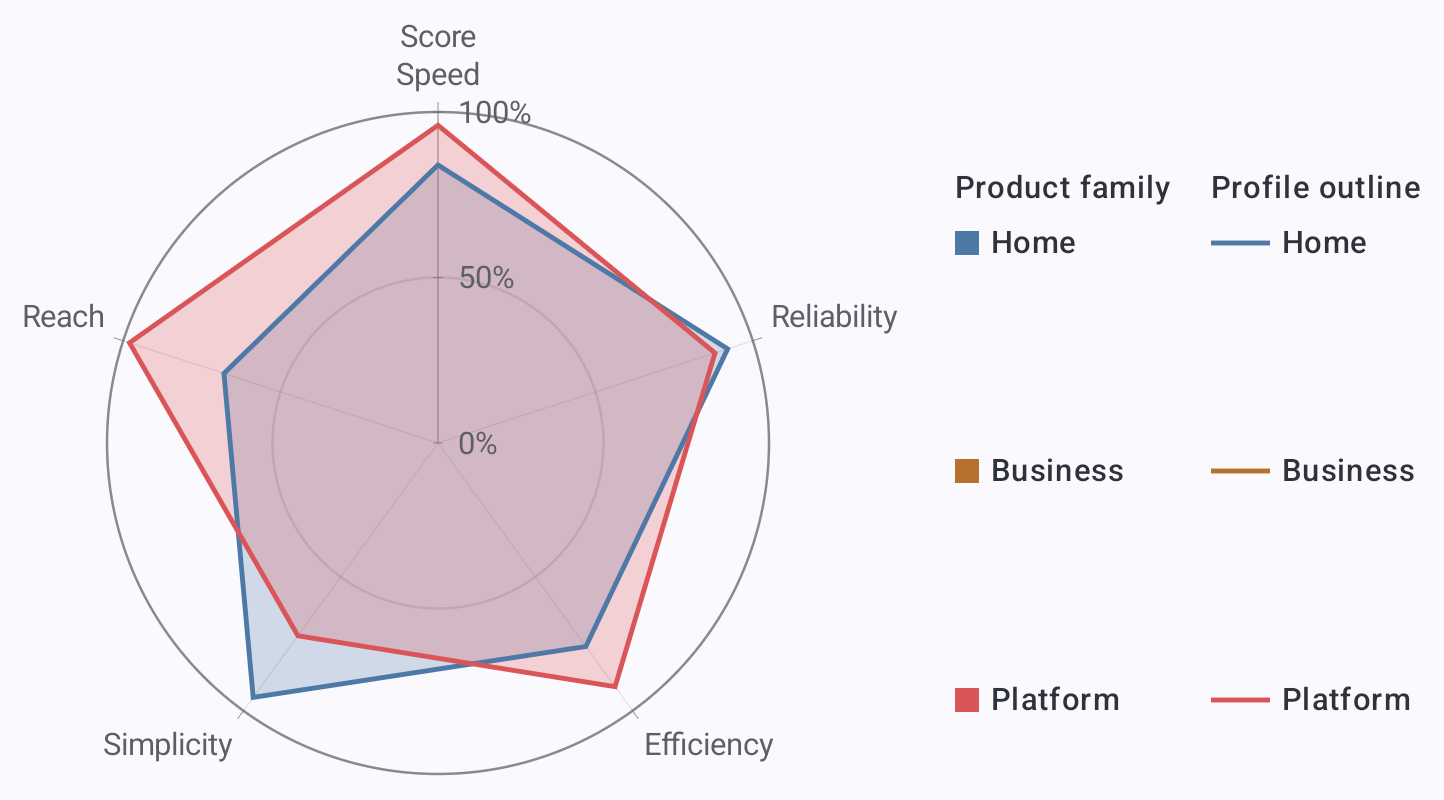
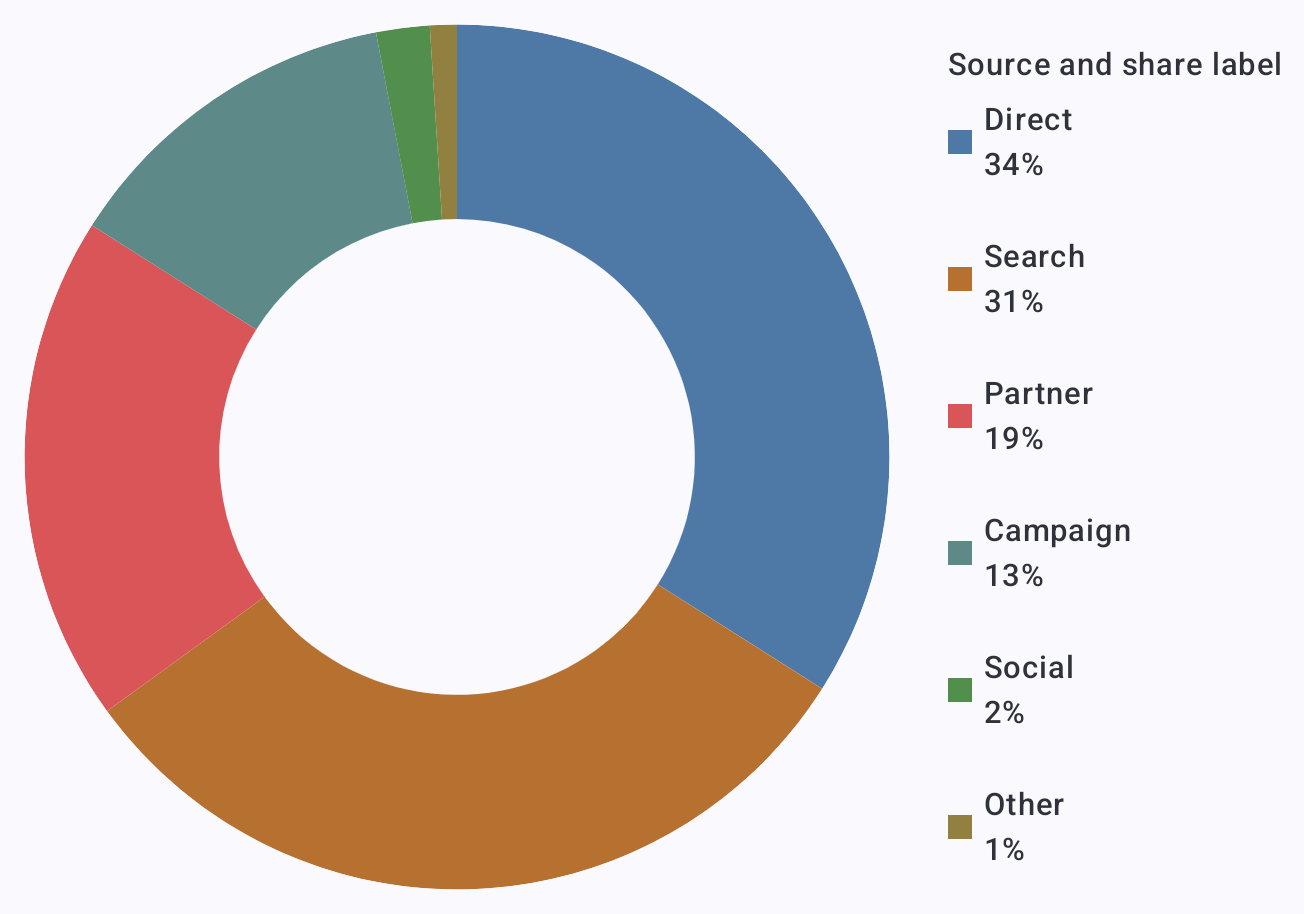
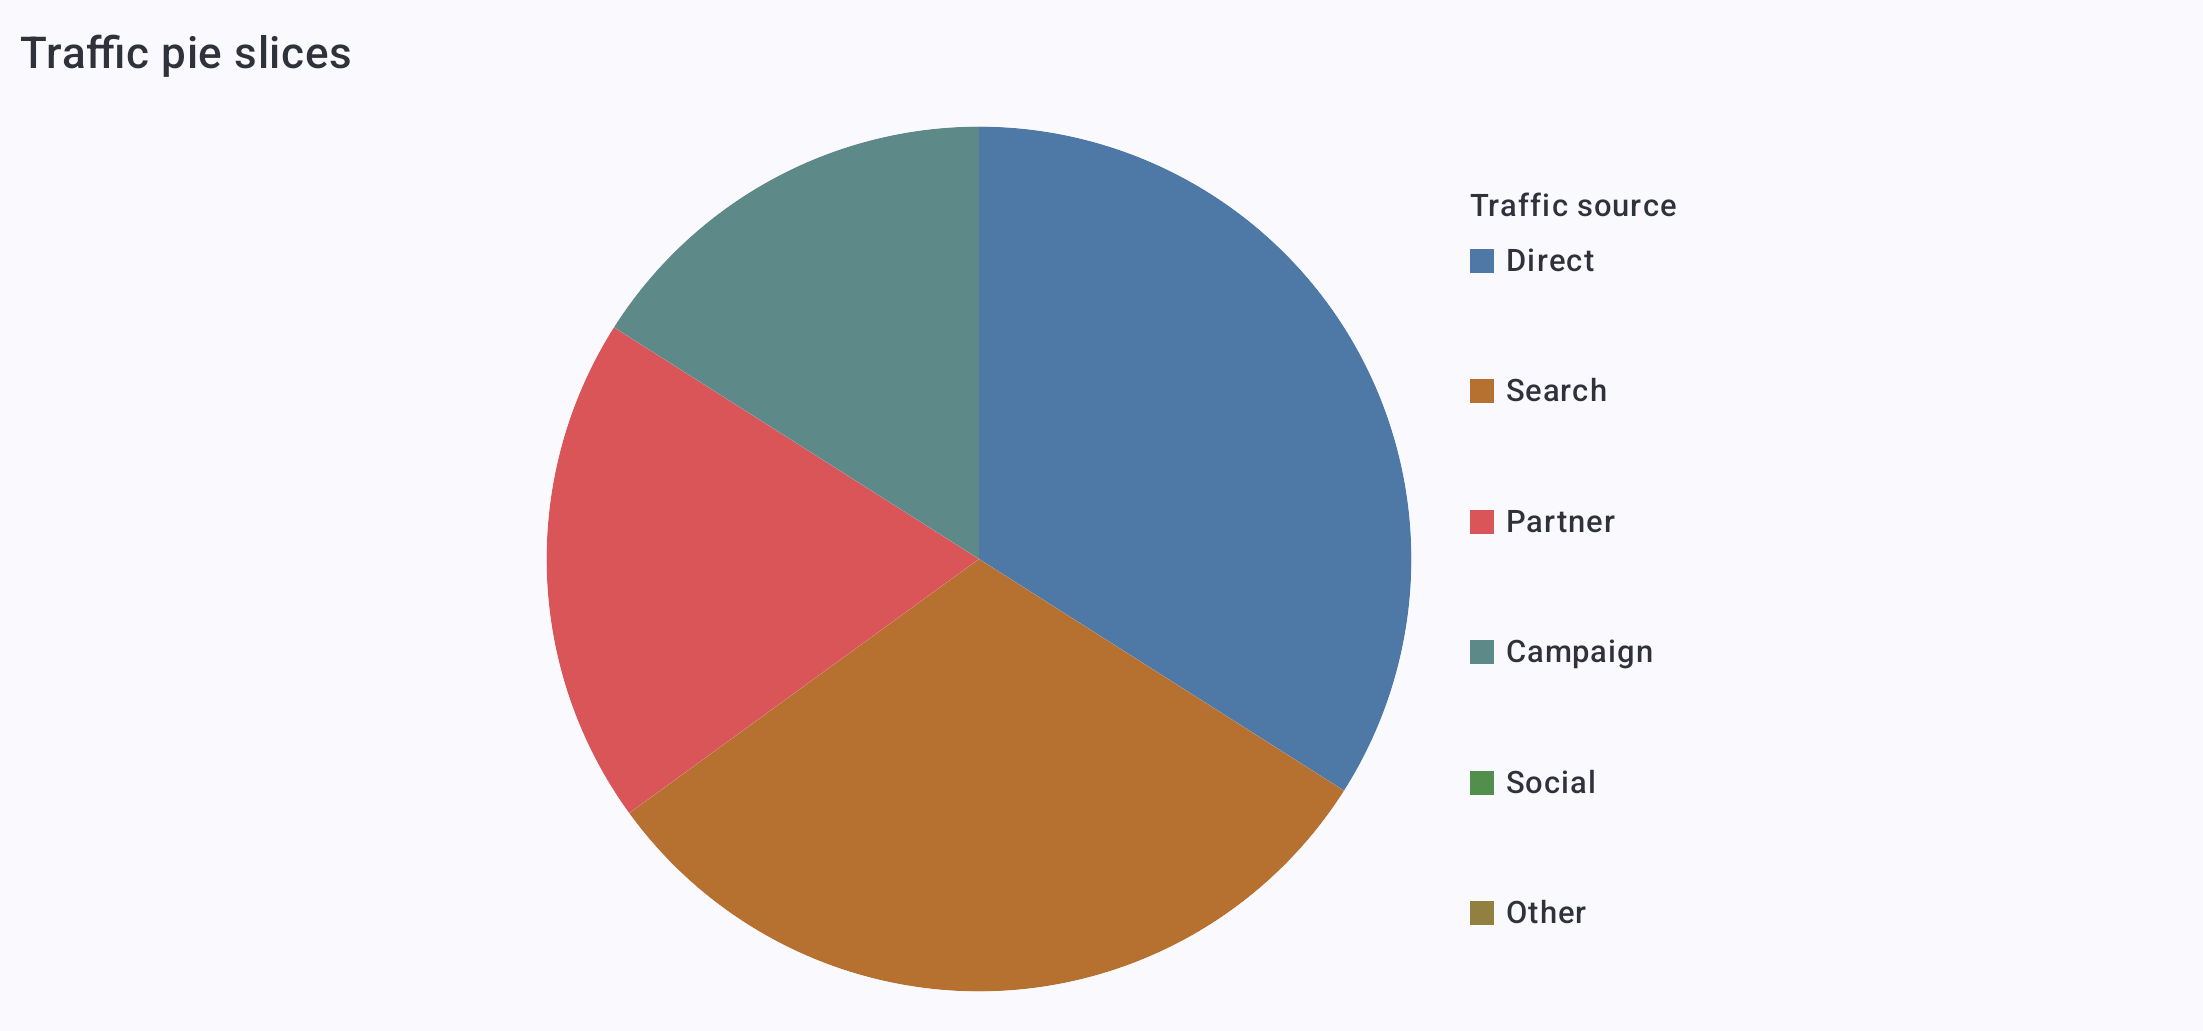
Radar · Compare capability profiles around a shared radial scale.Donut · Compare traffic shares with source labels and percentages.Pie · Show each traffic source’s share of the whole.
Maps and relationships
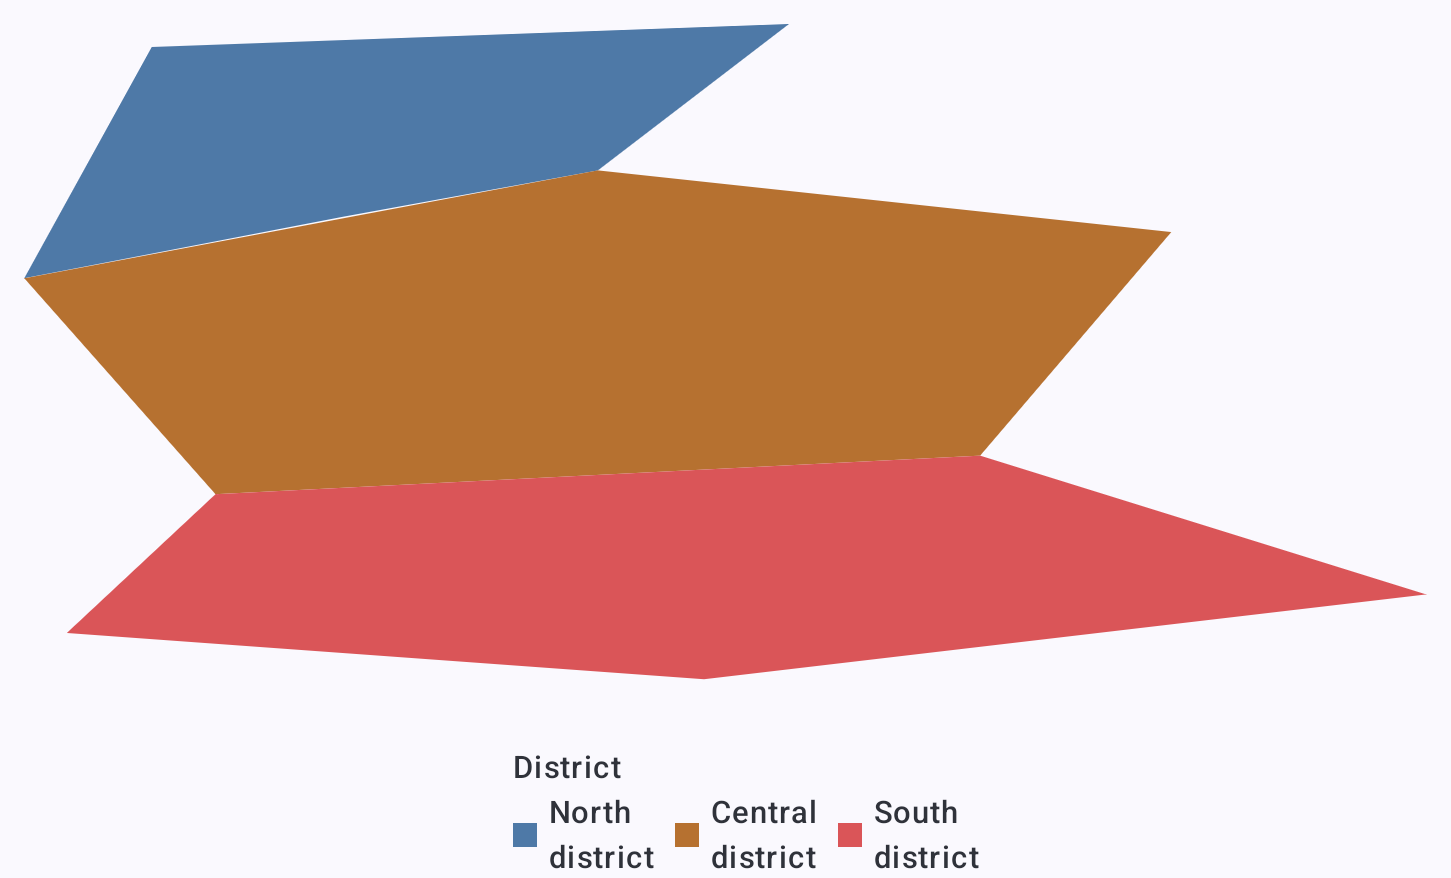
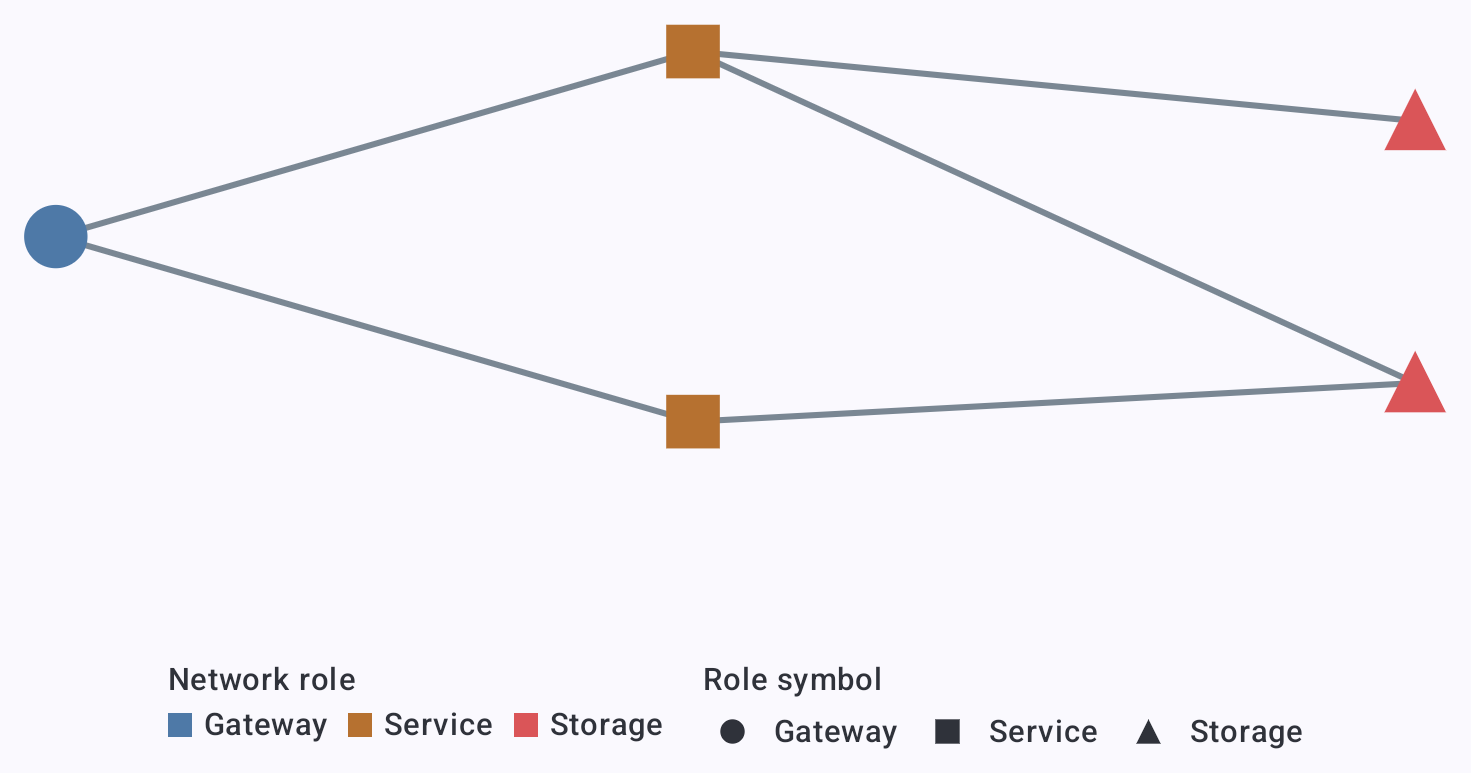
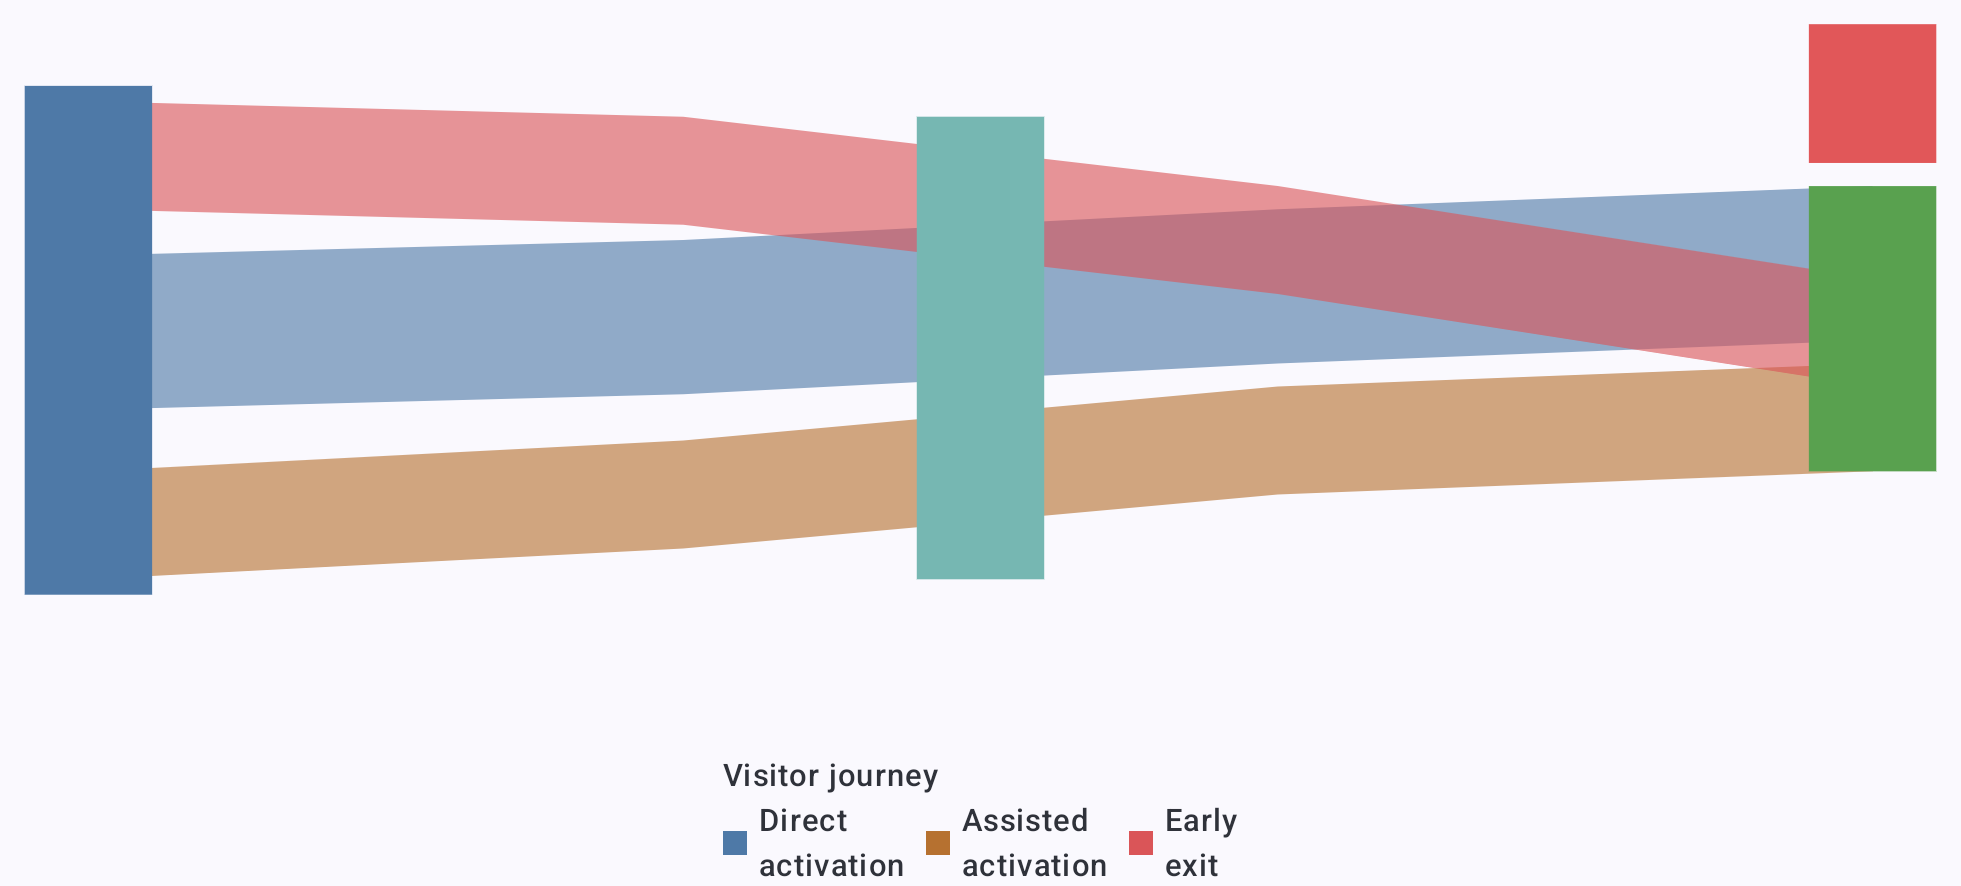
Projected map · Draw fictional district boundaries from supplied coordinates.Network · Connect gateway, service, and storage nodes.Sankey flow · Trace visitor journeys with ribbons sized by flow.
3D charts
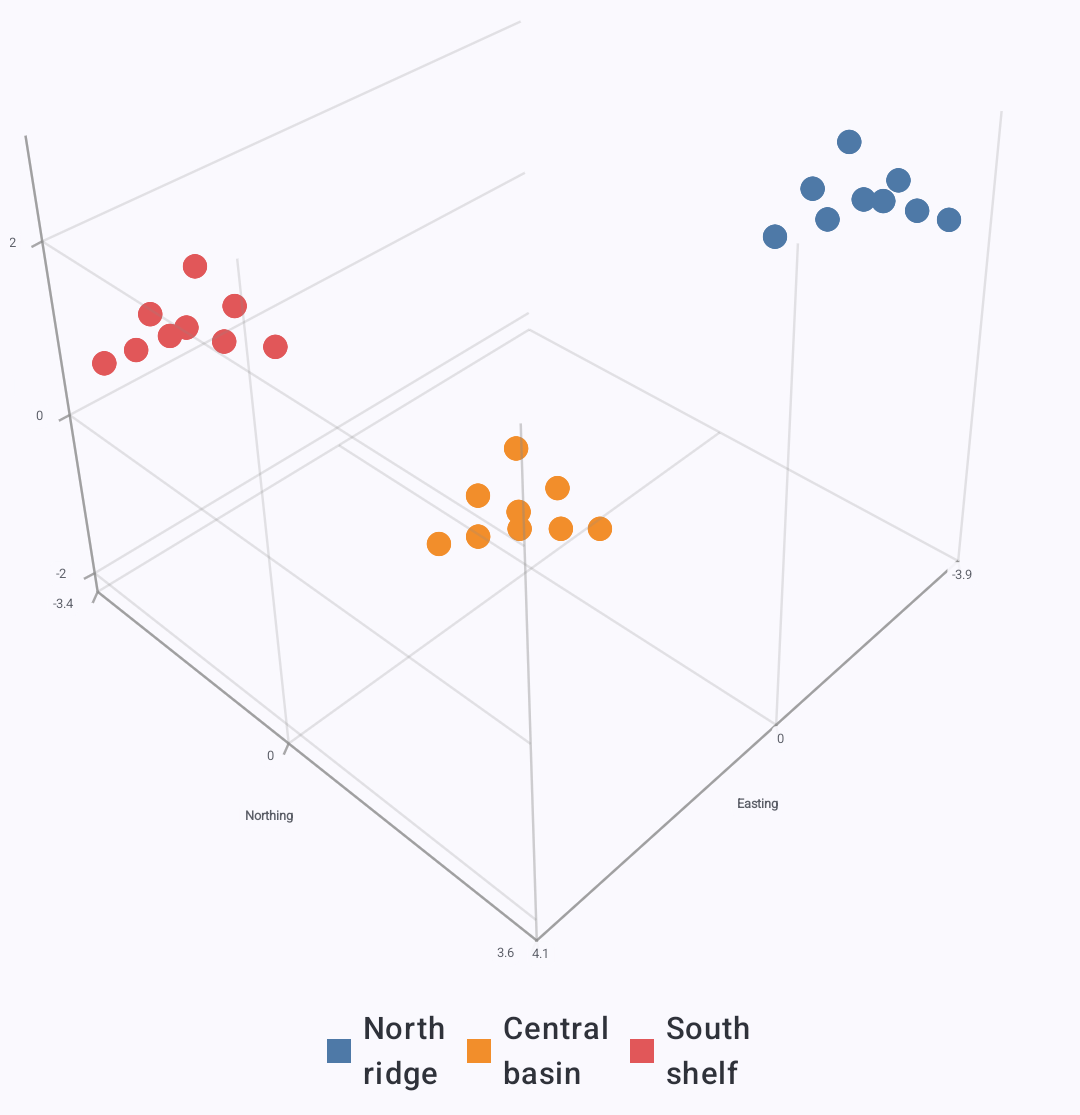
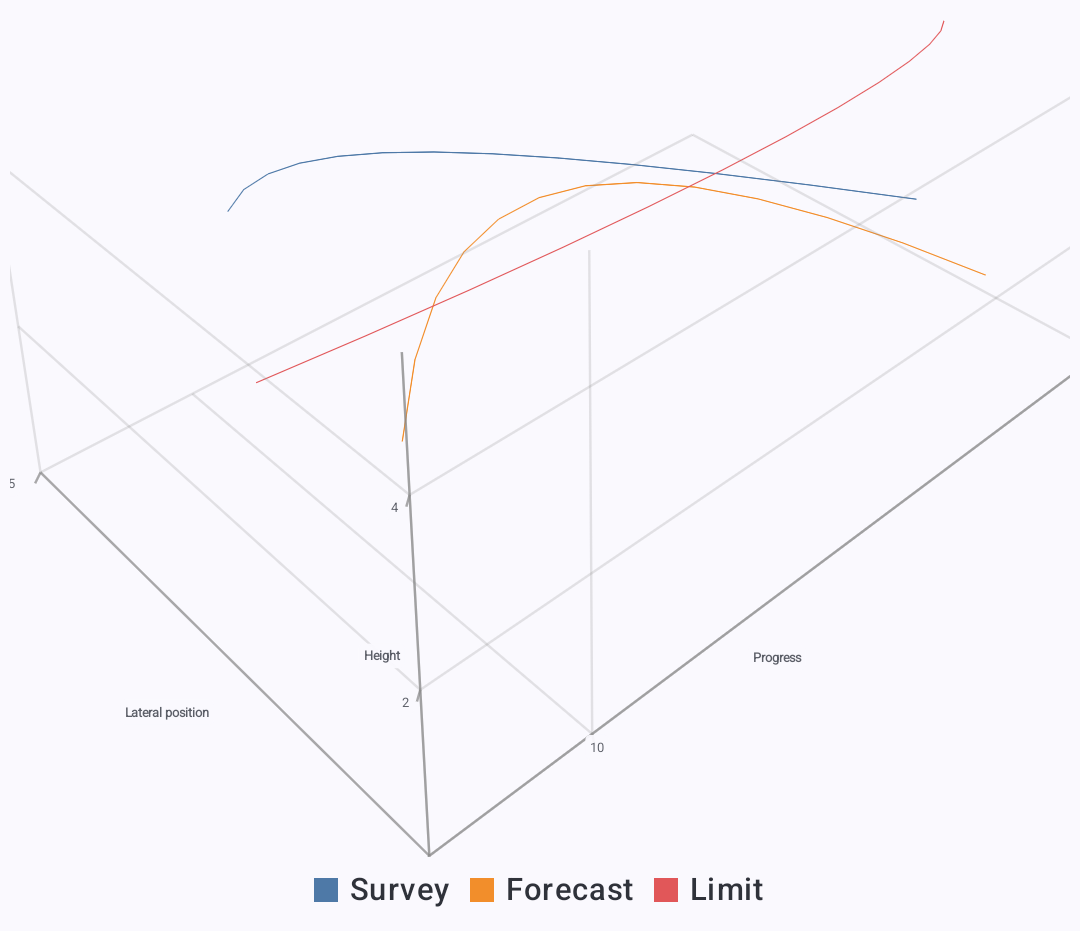
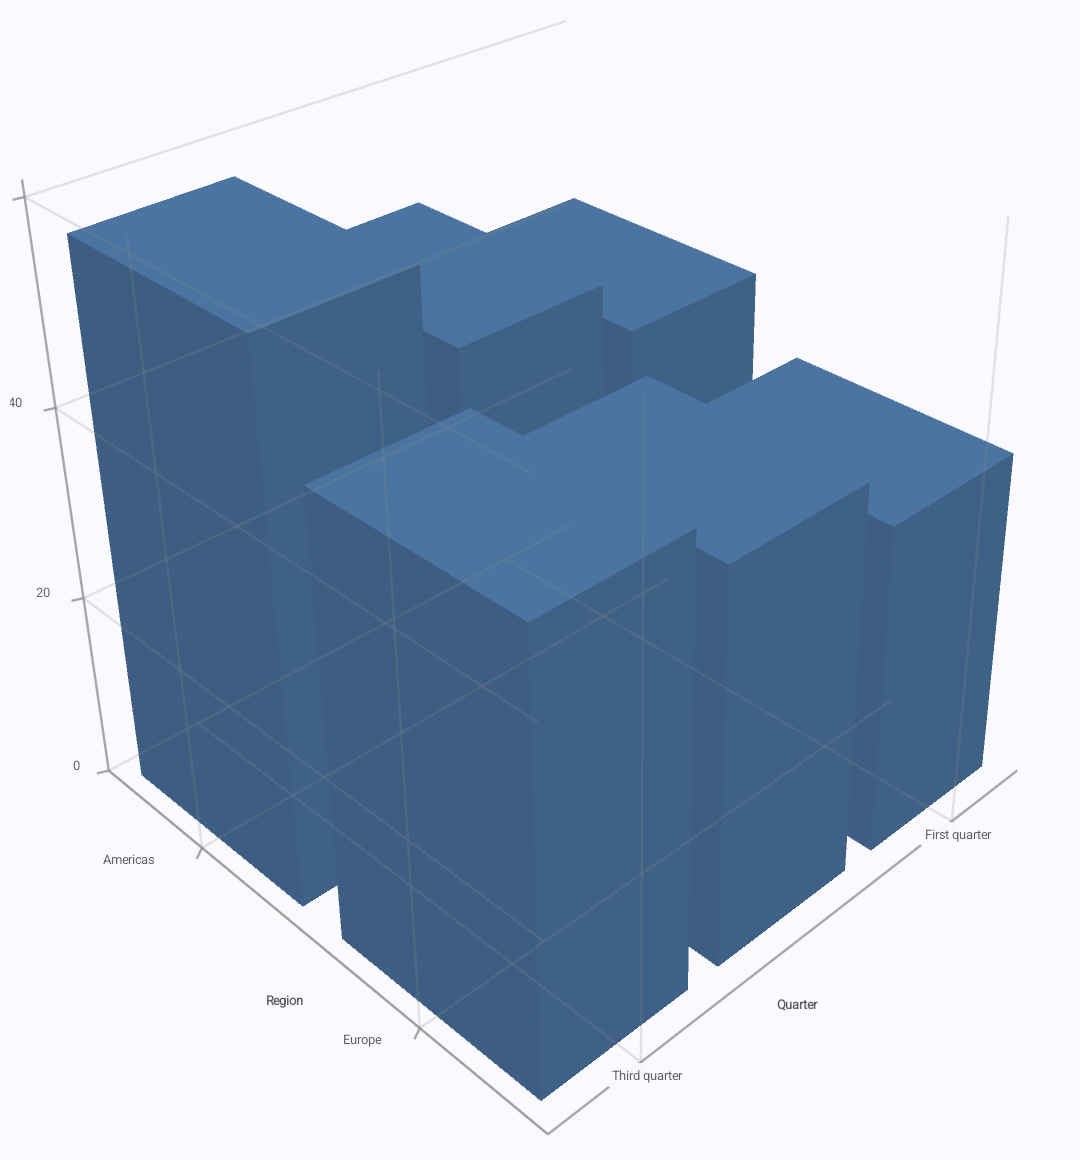
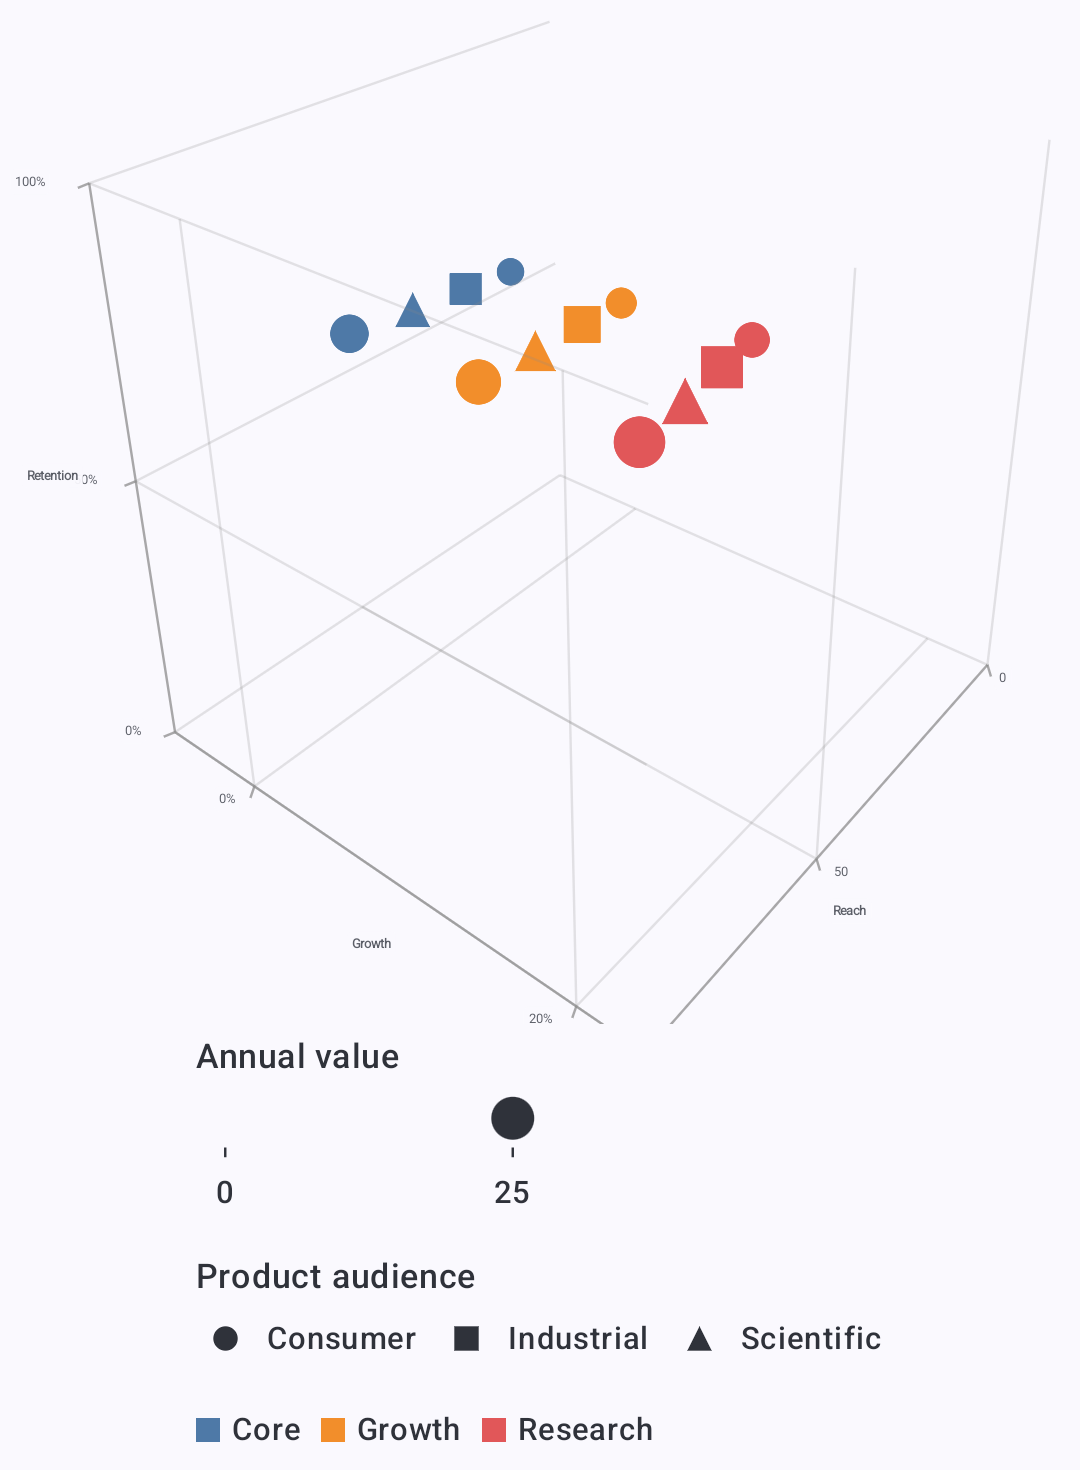
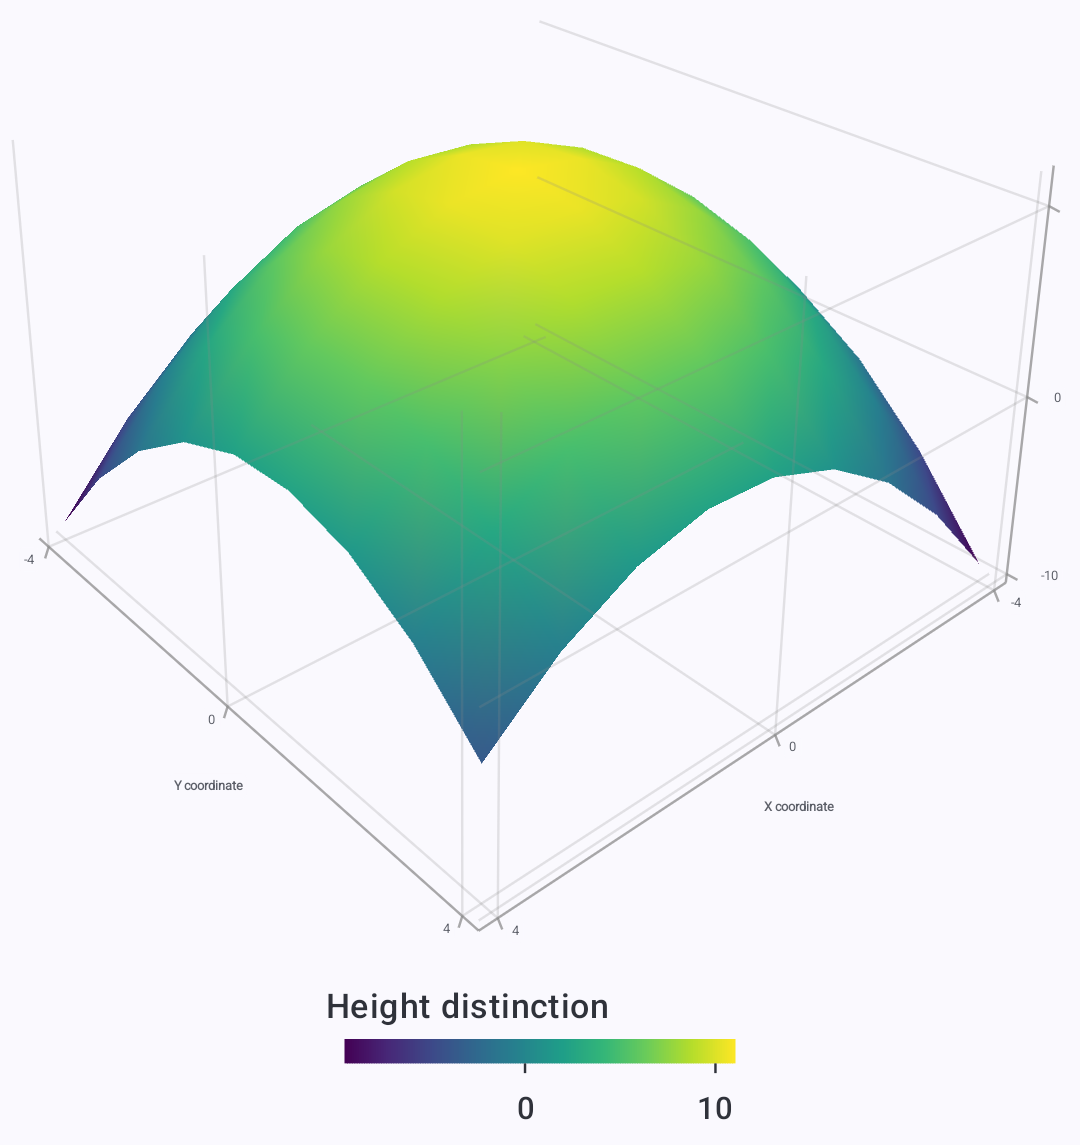
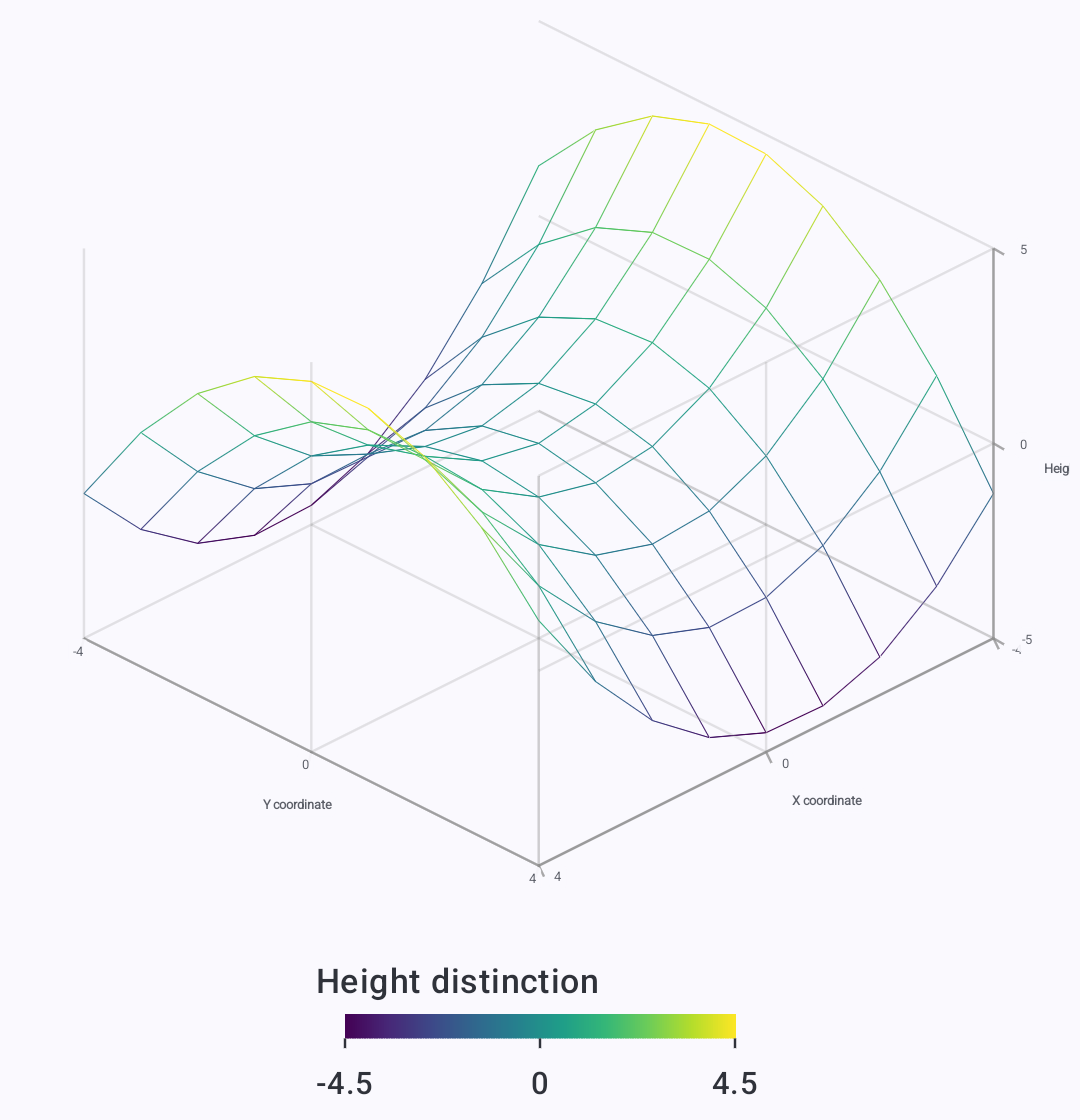
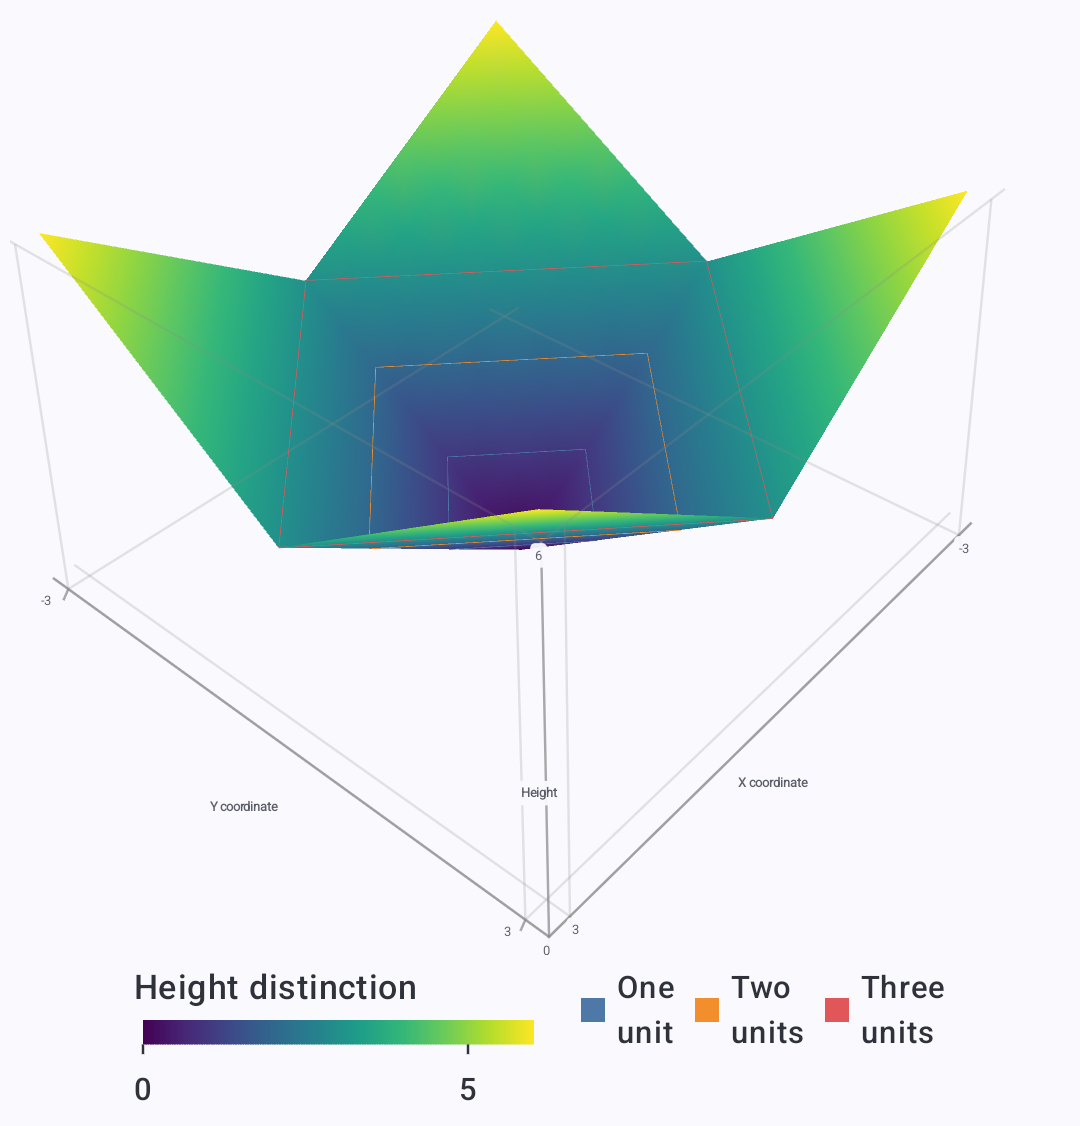
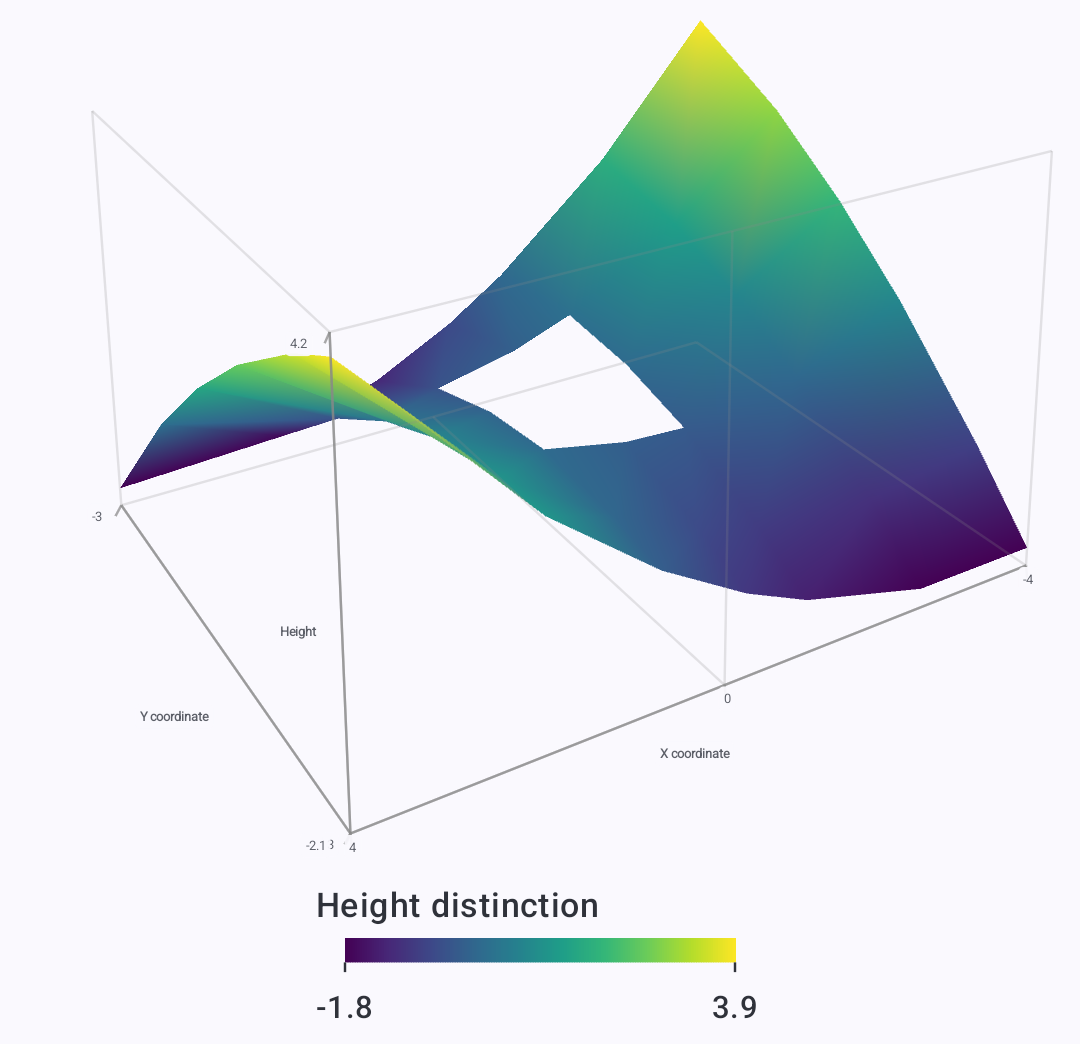
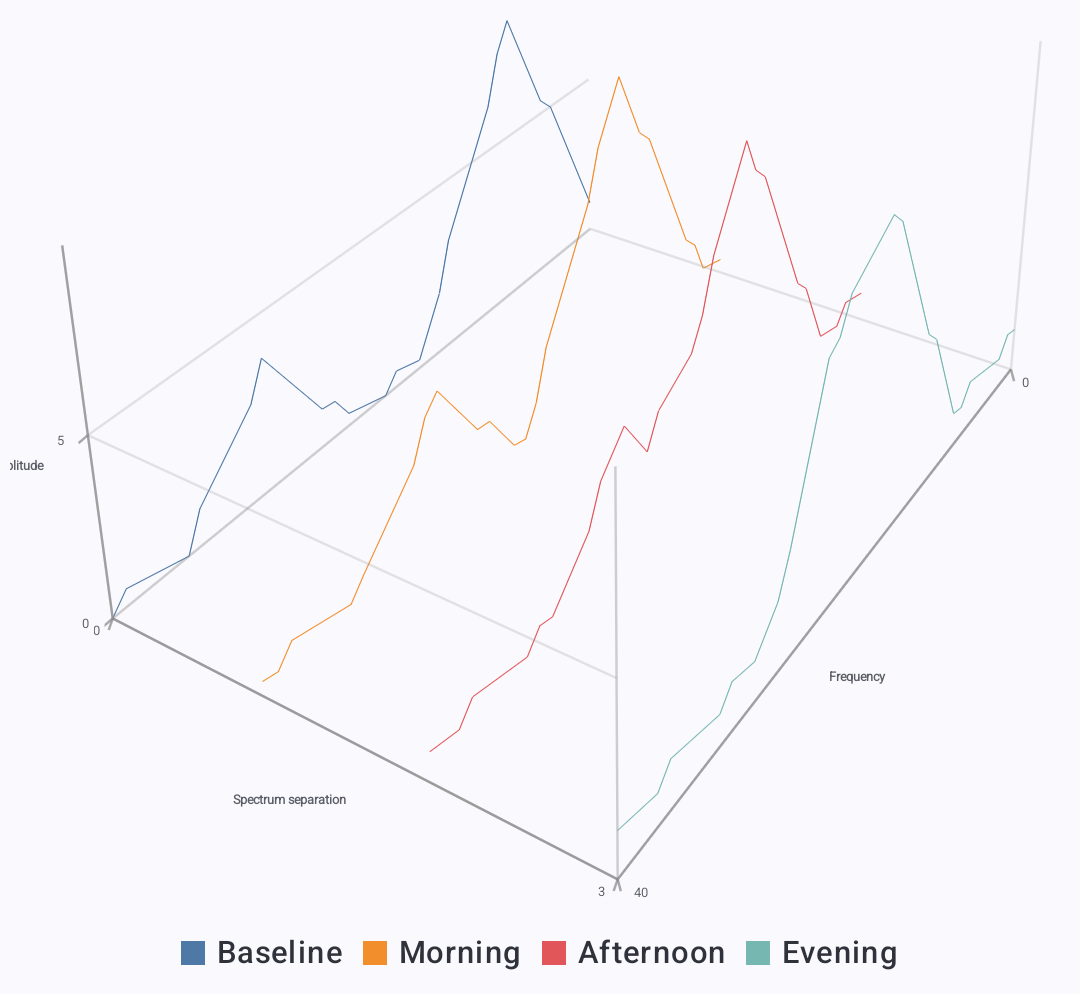
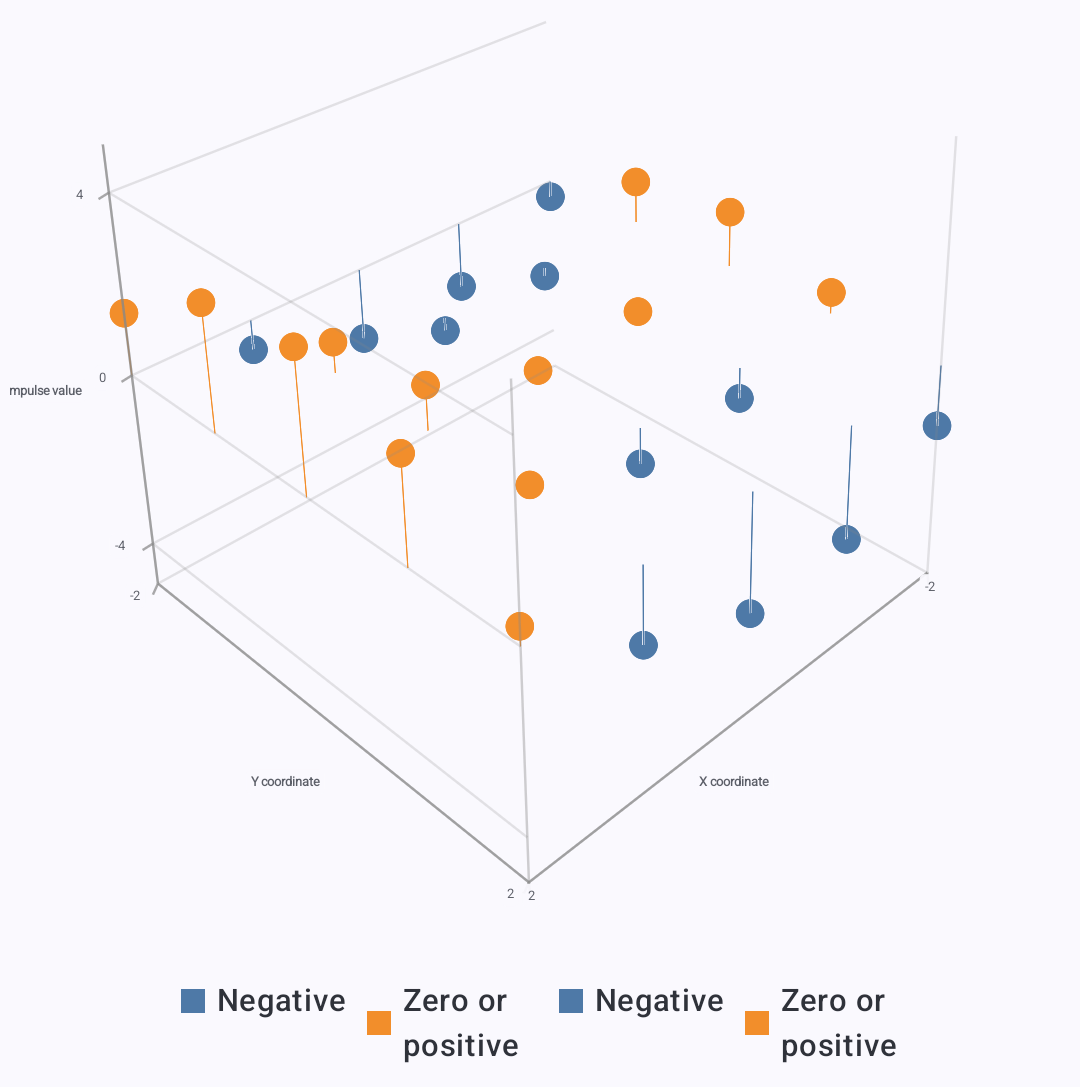
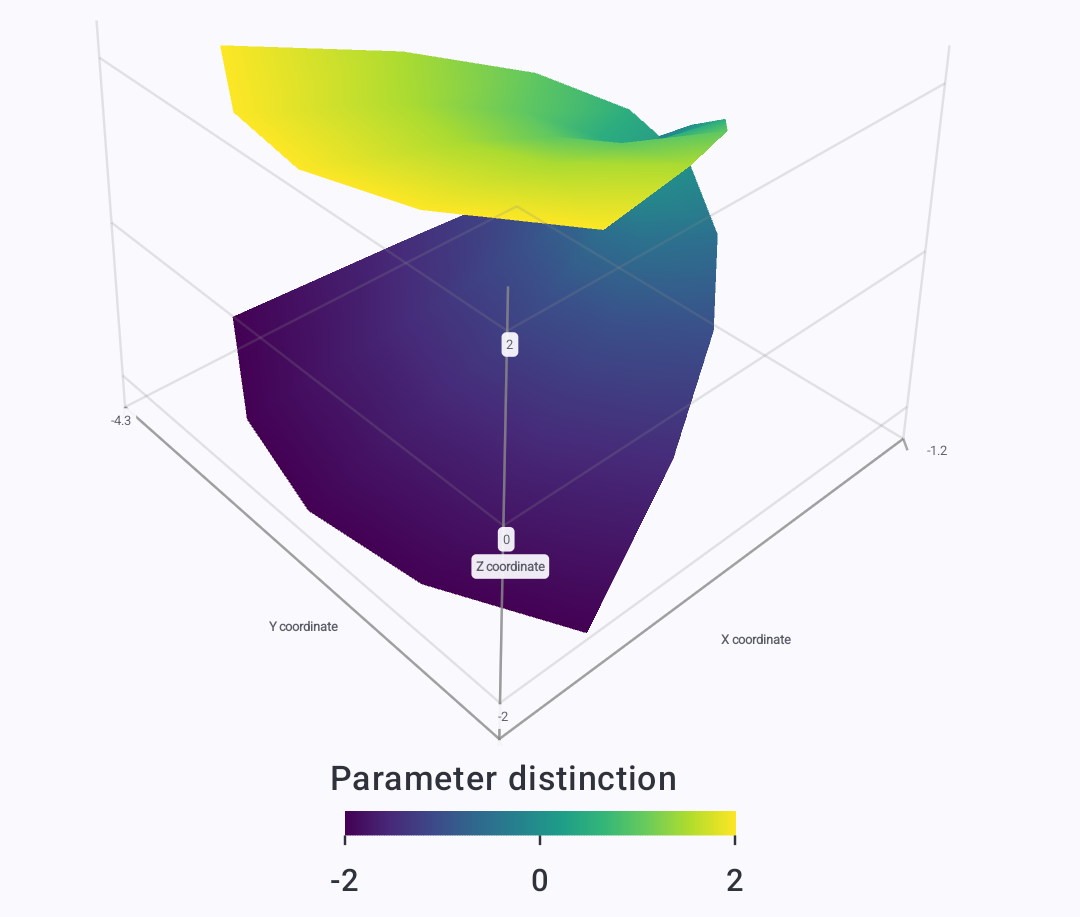
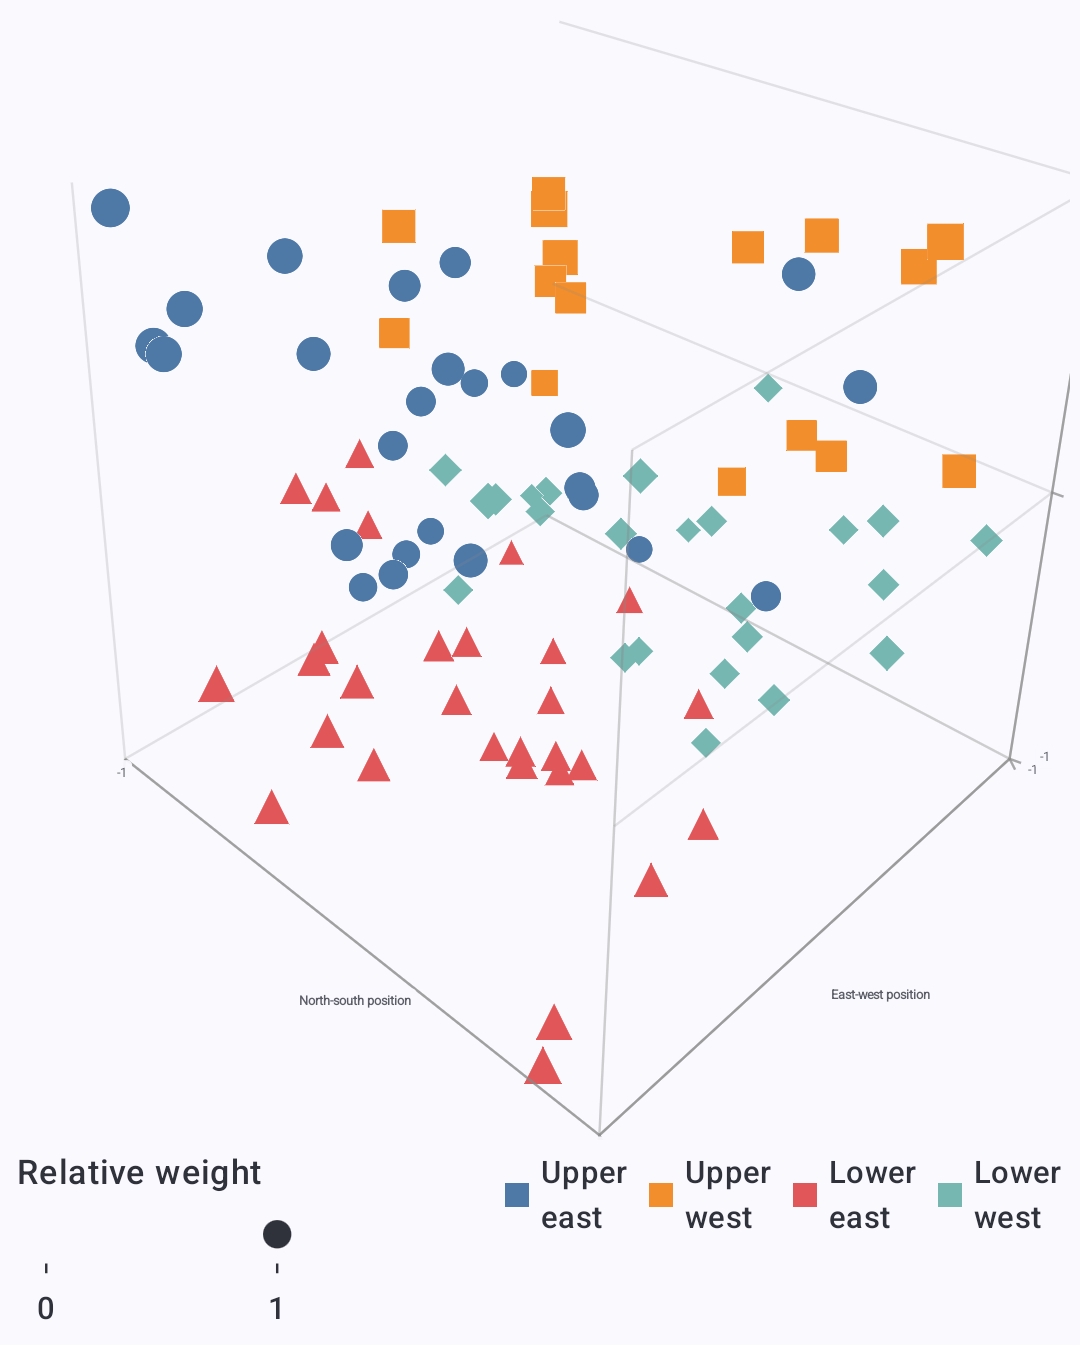
Scatter · Compare spatial sample clusters in three dimensions.Trajectories · Trace multiple paths through three-dimensional space.Columns · Compare values as columns across two horizontal dimensions.Bubbles · Combine position, bubble size, color, and shape.Height map · Reveal terrain height through surface geometry and color.Wireframe · Show the structure of a saddle surface as a mesh.Surface contours · Overlay contour paths on a colored surface.Nonuniform surface · Build a surface from unevenly spaced samples.Waterfall spectra · Separate spectrum traces along a third axis.Impulse stems · Show positive and negative impulses with stems and tips.Parametric surface · Visualize a mathematical surface from supplied coordinates.Point cloud · Compare a dense collection of points with size, shape, and color.